
Figure 1. SEC HPLC analyses of LNDs.
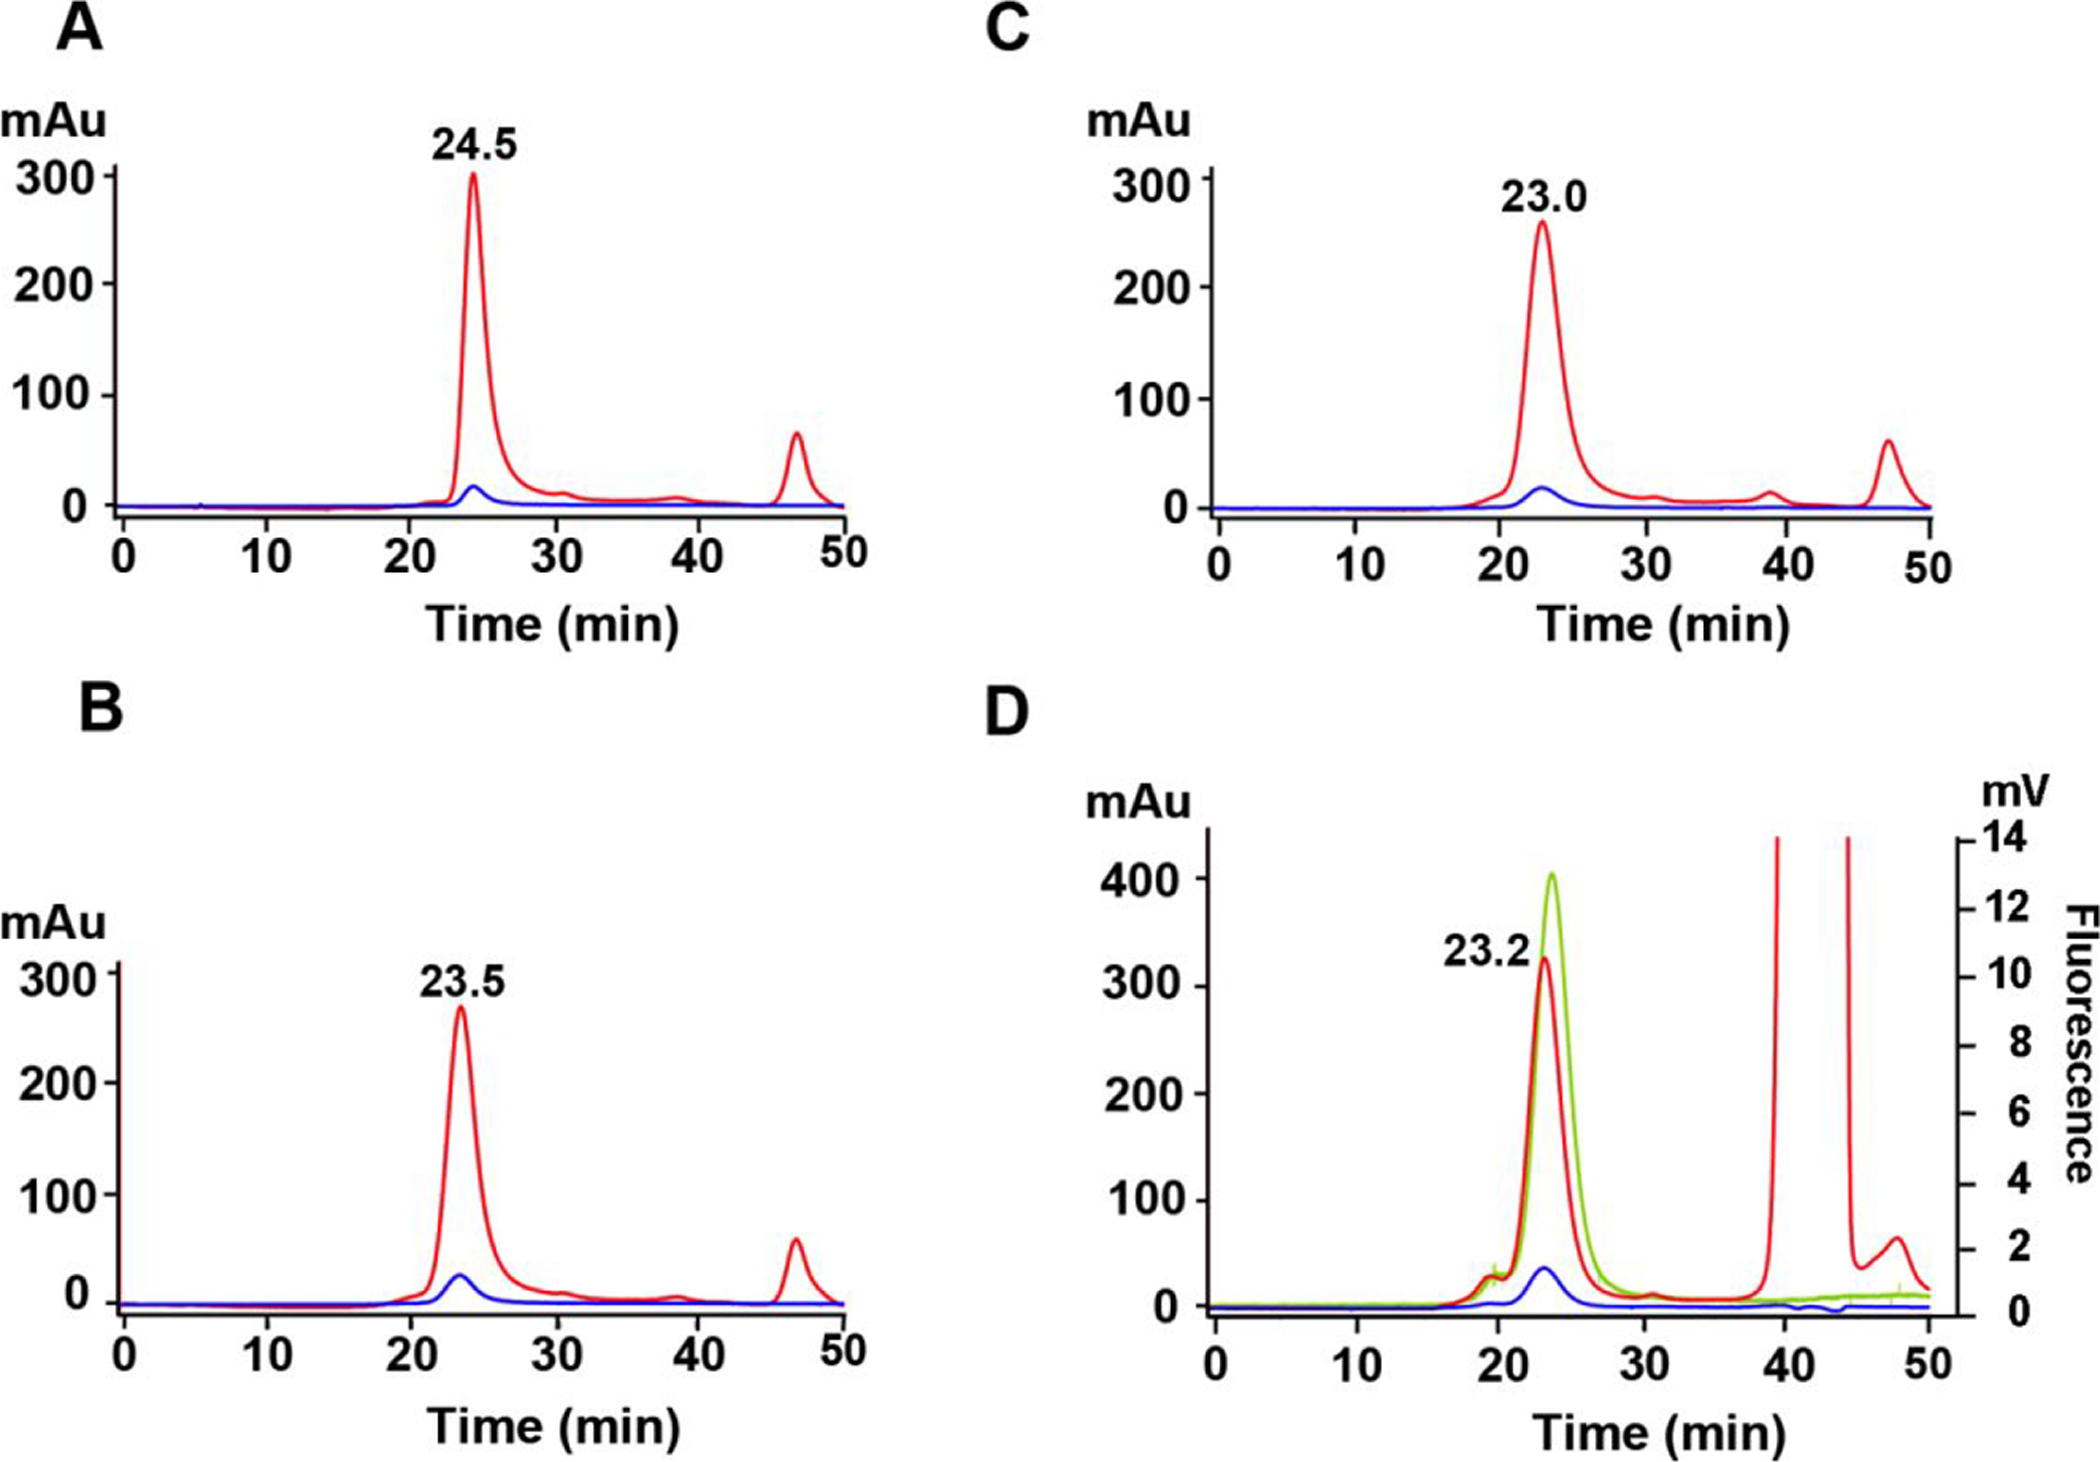
A. DMPC-LND. B. DSPE-PEG2000-DBCO LND. C. Azido-monoamide-DOTA + DSPE-PEG2000-DBCO LND. D. Azido-PEG4-Dox + DSPE-PEG2000-DBCO LND. The large 214 nm peak at 42 min is due to the solvent DMSO. Red= 214 nm. Blue= 240 nm. Green= ex 470, em 595 fluorescence.