
Extended Data Fig. 6. Multiplex immunofluorescence (mIF) VECTRA staining of immune infiltrates in pre- and posttherapy tumors.
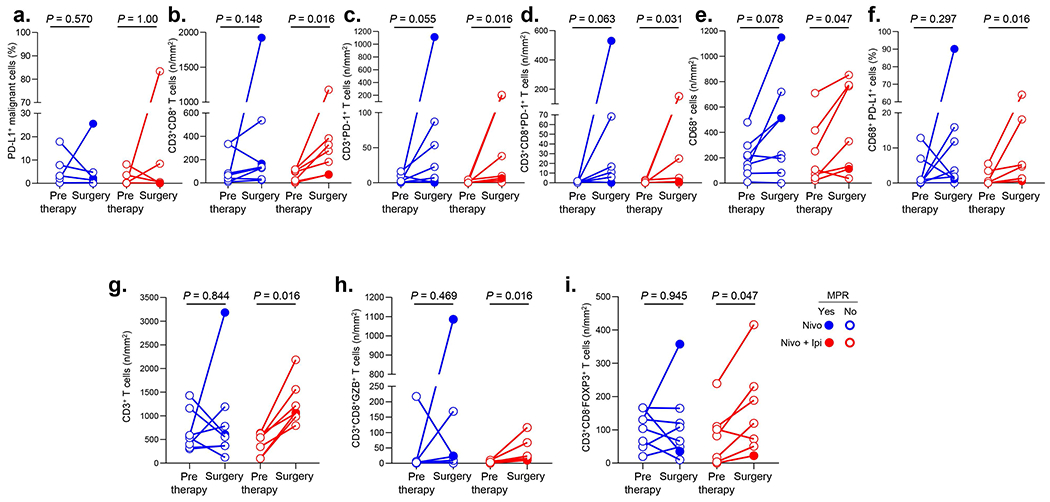
a-f, Staining of cell populations identified with co-expression markers in mIF VECTRA panel 1 as (a) PD-L1+ malignant cells (%), (b) CD3+CD8+ T cells (n/mm2), (c) CD3+PD-1+ T cells (n/mm2), (d) CD3+CD8+PD-1+ T cells (n/mm2), (e) CD68+ cells (n/mm2), (f) CD68+PD-L1+ cells (%) in resected (surgery) vs. pretherapy tumors treated with nivolumab (n = 8) or nivolumab plus ipilimumab (n = 7). g-i, Staining of cell populations identified with co-expression markers in mIF VECTRA panel 2 as (g) CD3+ T cells (n/mm2), (h) CD3+CD8+GZB+ T cells (n/mm2), (i) CD3+CD8−FOXP3+ T cells (n/mm2) in resected (surgery) vs. pretherapy tumors treated with nivolumab (n = 8) or nivolumab plus ipilimumab (n = 7). Experiments and scorings related to the presented results were conducted once. Two-sided P values are from Wilcoxon signed-rank test.