
Extended Data Fig. 8. Association between fecal microbiome diversity and tumor pathologic responses and TRAEs.
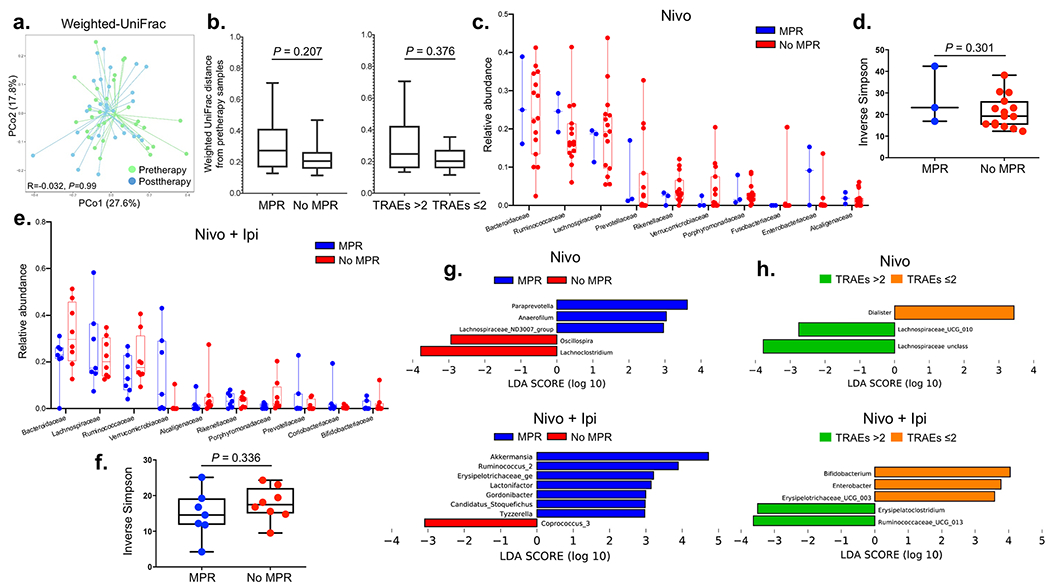
a, Ordination plots from principal coordinate analysis (PCoA) demonstrating clustering patterns of fecal microbiomes of patients at pre- (n = 30) and posttherapy (n = 28) using Weighted UniFrac distance. Two-sided P value is from analyses of similarities (ANOSIM) test performed with 999 permutations to calculate whether taxonomic composition between these two categories were significantly different. b, Box-and-whisker plots of pairwise distances between pre- and posttherapy samples within response and toxicity groups of patients having microbiome data (n = 25, MPR = 9, No MPR = 16; treatment-related adverse events (TRAEs) >2 = 12,TRAEs ≤2 = 13). The box portion of the plot is drawn from the first quartile to the third quartile with inside line indicating the median value. The whiskers extend from the ends of the box to the minimum and maximum data values. Two-sided P value is from Mann-Whitney U rank-sum test. c, Box-and-whisker plots of the relative distributions of the top ten most abundant bacteria at family level observed in MPR (n = 3) and No MPR (n = 15) in nivolumab-treated patients (top panel). The box portion of the plot is drawn from the first quartile to the third quartile with inside line indicating the median value. The whiskers extend from the ends of the box to the minimum and maximum data values. d, Inverse Simpson index estimating fecal bacterial diversity between MPR (n = 3) and No MPR (n = 15) in nivolumab-treated patients (bottom panel). The box portion of the plot is generated from the first quartile to the third quartile with inside line indicating the median value. The whiskers extend from the ends of the box to the minimum and maximum data values. Two-sided P value is from Mann-Whitney U rank-sum test. e, Box-and-whisker plots of the relative distributions of the top ten most abundant bacteria at family level observed in MPR (n = 7) and No MPR (n = 8) in nivolumab plus ipilimumab-treated patients. The box portion of the plot is generated from the first quartile to the third quartile with inside line indicating the median value. The whiskers extend from the ends of the box to the minimum and maximum data values. f, Inverse Simpson index estimating fecal bacterial diversities between MPR (n = 7) and No MPR (n = 8) in nivolumab plus ipilimumab-treated patients. The box portion of the plot is generated from the first quartile to the third quartile with inside line indicating the median value. The whiskers extend from the ends of the box to the minimum and maximum data values. Two-sided P value is from Mann-Whitney U rank-sum test. g, Linear Discriminant Analysis (LDA) Effective Size (LEfSe) used to estimate discriminative features in fecal microbiomes at genus level between MPR (n = 3) and No MPR (n = 15) in nivolumab (top) and nivolumab plus ipilimumab-treated patients (bottom; MPR, n = 7 and No MPR, n = 8) pretherapy. The length of the bar indicates the effect size associated with a genus. Alpha value of 0.05 for the factorial Kruskal-Wallis test and logarithmic LDA score of 2 were used to calculate the discriminative features. h, LDA Effect Size (LEfSe) plot of pairwise comparisons of bacterial taxa at genus level dichotomized by TRAE categories in nivolumab-treated patients (top panel) (TRAEs ≤2 (n = 10) and TRAEs >2 (n = 10)) and in nivolumab plus ipilimumab-treated patients (bottom panel) (TRAEs ≤2 (n = 9) and TRAEs >2 (n = 10)). Alpha value of 0.05 for the factorial Kruskal-Wallis test and logarithmic LDA score of 2 were used to calculate the discriminative features.