
Extended Data Fig. 9. Association between fecal microbiome diversity and tumor TCR clonality and richness.
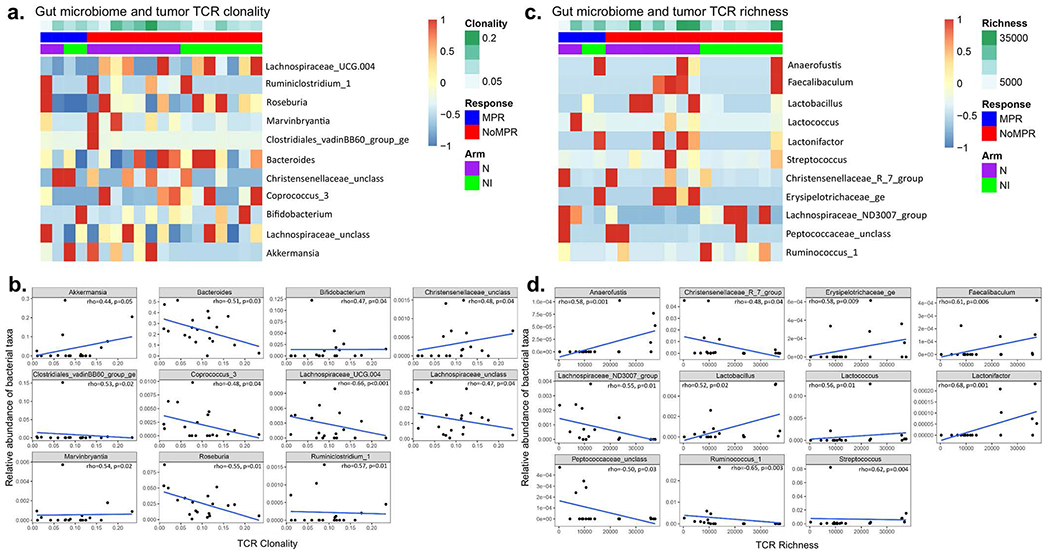
a,c, Heatmaps showing pretherapy taxonomic abundances at various levels in nivolumab (n = 10) and nivolumab plus ipilimumab (n = 9) arms and posttherapy tumor TCR clonality (a) and richness (c). b,d, The relationships between the microbiome and TCR clonality (b) and richness (d) were conducted using the linear regression model. Spearman correlation test (two-sided) was used to calculate the rho and P values. Here, the unadjusted P value cutoff of 0.05 was used.