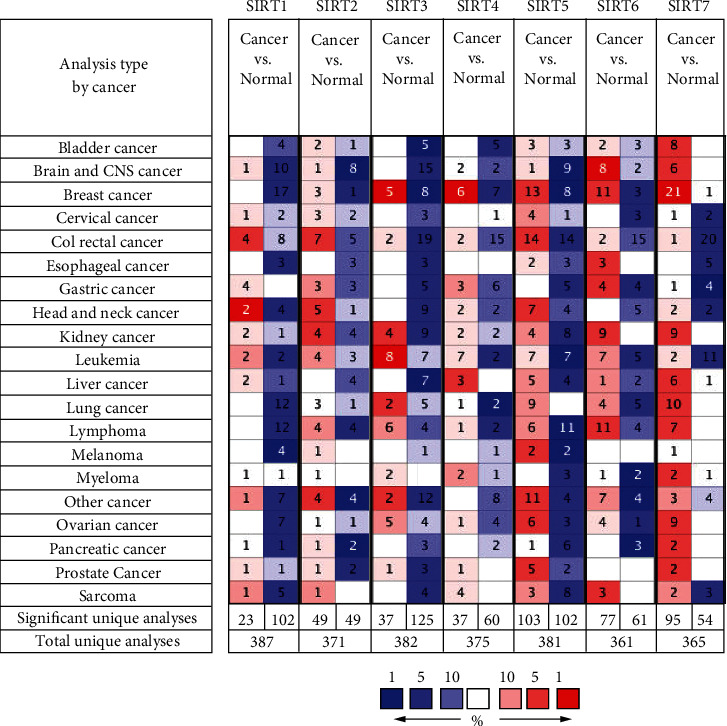
Figure 1.

The transcription levels of SIRTs in different types of cancers (Oncomine). Red color represents elevated expression, and blue color represents reduced expression. The depth of the color represents the best gene rank percentile.

The transcription levels of SIRTs in different types of cancers (Oncomine). Red color represents elevated expression, and blue color represents reduced expression. The depth of the color represents the best gene rank percentile.