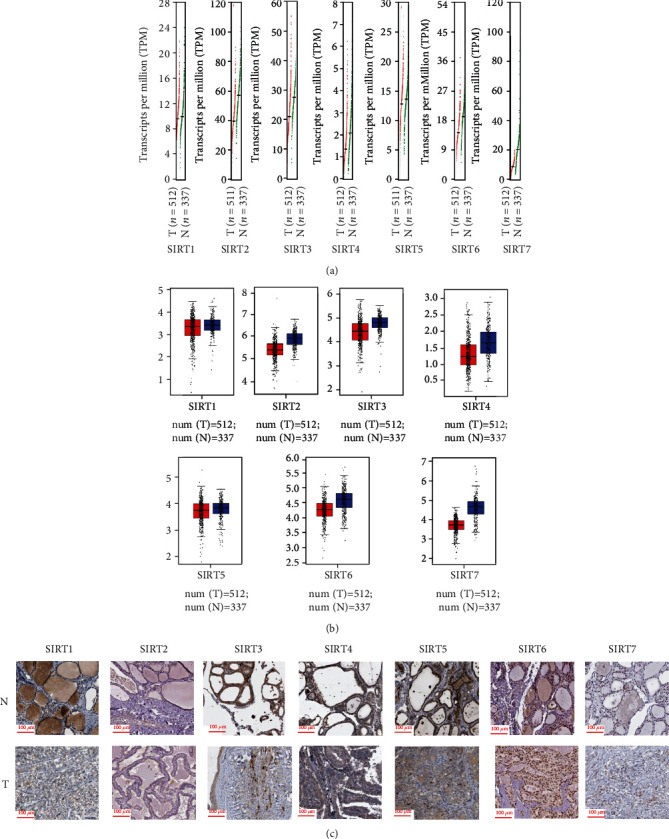
Figure 2.

The expression of SIRT family members in DTC using GEPIA. (a) Scatter diagram showing the expression profile of SIRTs in DTC and normal samples. Red color represents the SIRT expression level in tumor samples, and green color represents the SIRT expression level in normal samples. (b) Box plot showing the expression of SIRTs in DTC and normal samples. Red color represents the SIRT expression level in tumor samples, and blue color represents the SIRT expression level in normal samples. (c) Representative IHC images of SIRTs in DTC. T represents tumor tissues and N represents normal tissues. Positive staining was mainly concentrated at the nucleus.
