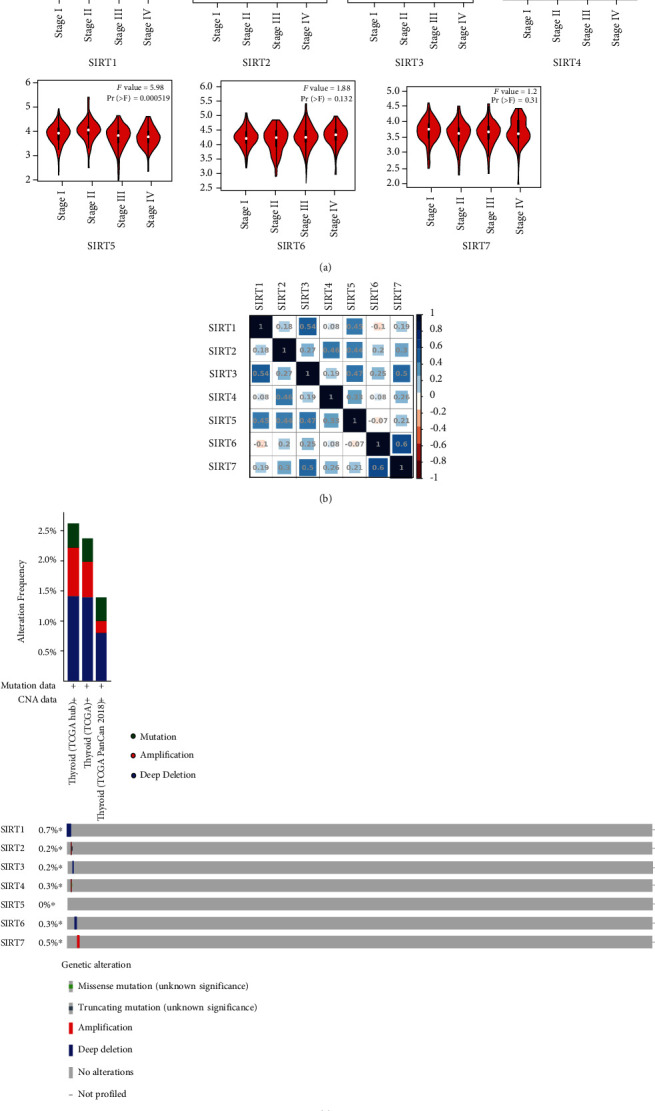
Figure 3.

Correlation between SIRT expression and tumor stage in DTC (GEPIA) and genetic variation. (a) Association between the expression level of SIRTs and tumor stages. (b) Correlation analysis between SIRTs in DTC. Darker colors represent the higher correlation. (c) Genetic variation of SIRTs in DTC. Genetic variation included mutation, amplification, and deep deletion.
