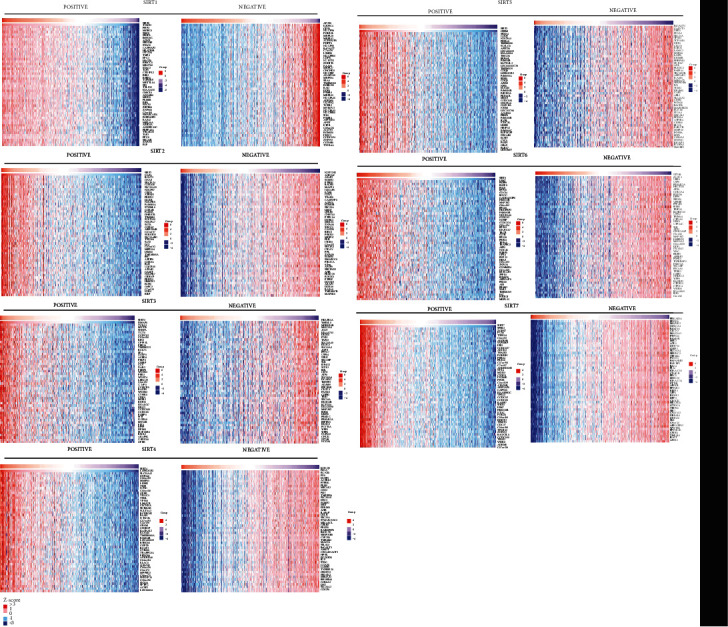
Figure 6.

Heatmap plot of association results showing the correlation of different SIRTs with gene expression in DTC (LinkedOmics). Top 50 genes with the greatest correlation were presented.

Heatmap plot of association results showing the correlation of different SIRTs with gene expression in DTC (LinkedOmics). Top 50 genes with the greatest correlation were presented.