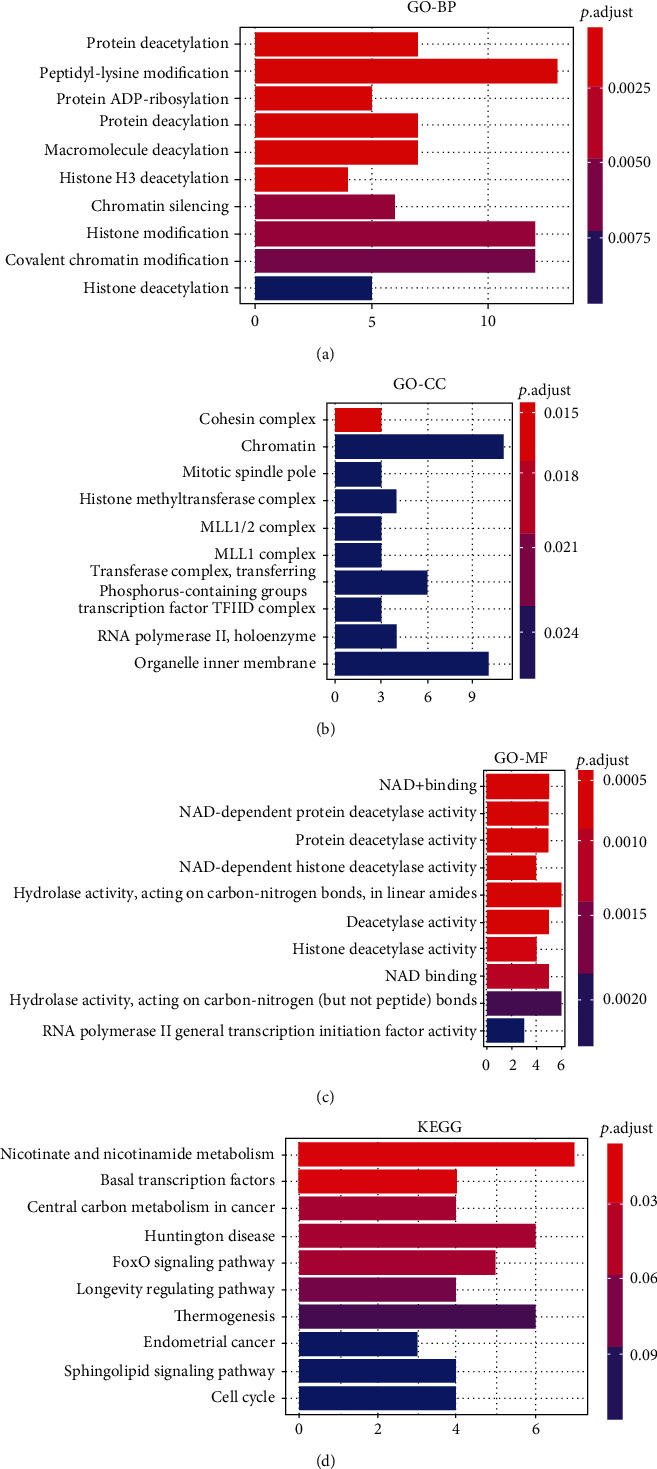
Figure 7.

Functional enrichment analysis of SIRTs and coregulated genes in DTC. (a) Biological process. (b) Cellular component. (c) Molecular function. (d) KEGG pathways. The intensity of the colors represents the p value (the redder the color, the lower p value). Top 10 significant terms were presented.
