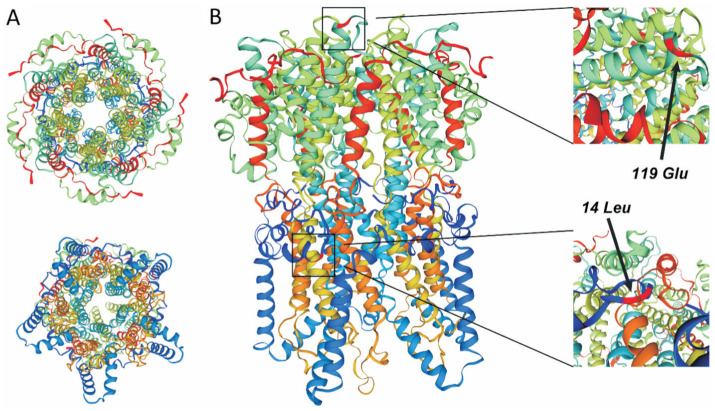
Figure 5. Cartoon diagram of the human BEST (hBEST1) pentamer with each protomer colored differently.
The overall structures of BEST1 show the ion pore (A), as viewed from the intracellular side (top) and extracellular side (bottom). The orthogonal view shows the exact site of altered residues in the bestrophin-1 of the two families (B).

