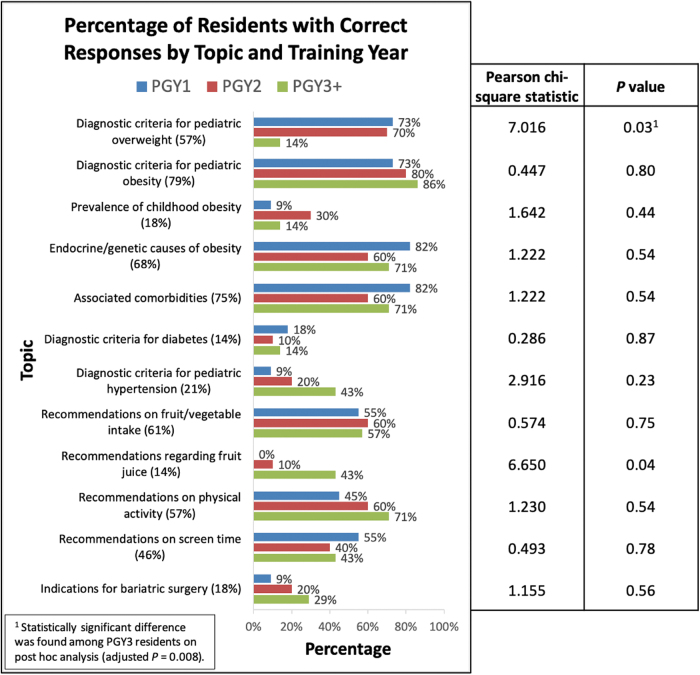
Figure 1.
Proportion of trainees with correct responses to objective questions by topic and PGY status. In addition, the description of each topic is followed by the total percentage of residents who answered that corresponding question correctly. Results of the Pearson chi-square test are presented in the columns to the right. PGY, postgraduate year.

