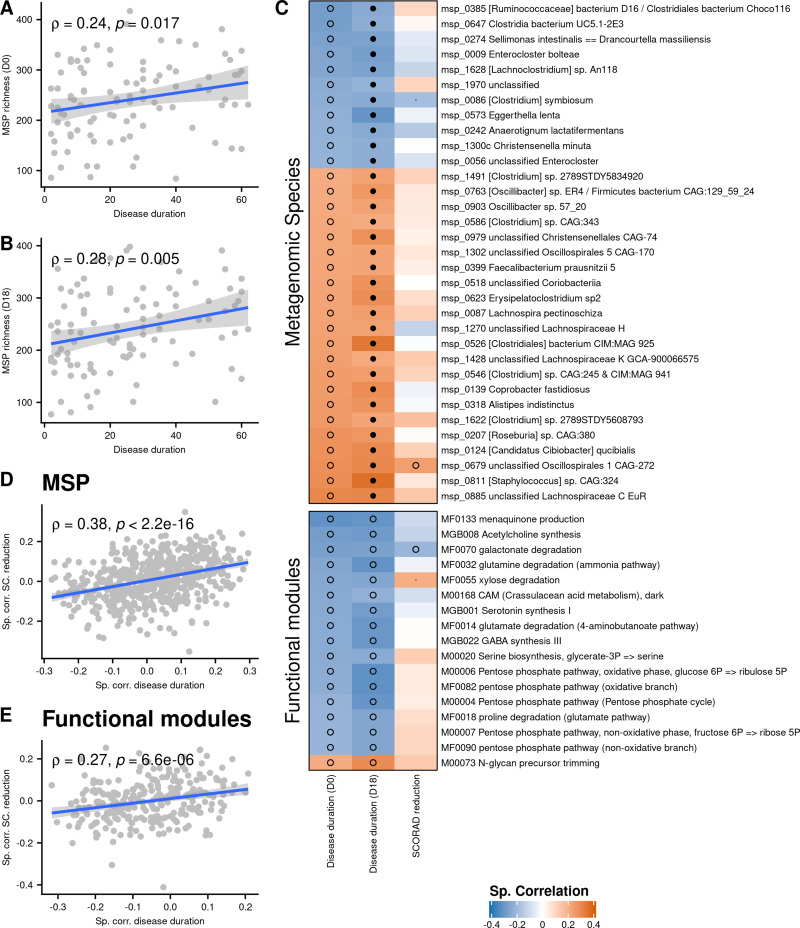
Figure 3.
(A and B) MSP richness as a function of disease duration at D0 and D18. (C) Spearman correlations between abundance of Metagenomics Species (MSP) or functional modules, disease duration and SCORAD reduction. Only MSPs and functional modules correlated with disease duration at both D0 and D18 (p ≤ 0.05) are shown. Correlation between disease duration and metagenomics features are computed using a partial Spearman correlation to take age into account. Black dots represent correlations with FDR ≤ 0.1; empty circles represent correlations with p ≤ 0.05. (D) Correlations of MSPs with SCORAD amelioration (y-axis) in function of correlations of MSPs with disease duration (x-axis). (E) Correlations of functional modules with SCORAD amelioration (y-axis) in function of correlations of functional modules with disease duration (x-axis).

