Figure 3.

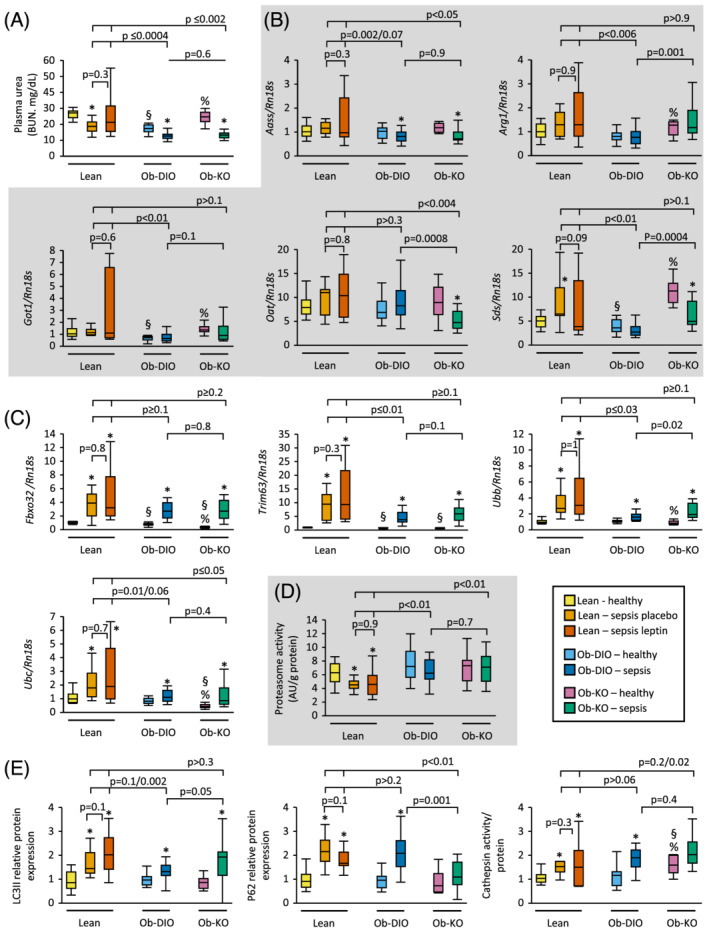
Amino acid catabolism and muscle protein breakdown. (A) Blood urea nitrogen (Kruskal–Wallis P < 0.0001). (B) Relative mRNA expression of enzymes involved in amino acid catabolism in the liver (Kruskal–Wallis P ≤ 0.005). (C) Relative mRNA expression of markers of atrophy in gastrocnemius muscle (GNM) (Kruskal–Wallis P < 0.0001). (D) GNM proteasome activity (Kruskal–Wallis P = 0.002). (E) Relative GNM protein expression of LC3II, P62, and muscle cathepsin activity (Kruskal–Wallis P < 0.0001). Gene and protein expression data are shown relative the median of lean healthy mice. Lean healthy n = 17, lean sepsis placebo n = 11, lean sepsis leptin n = 14, Ob‐DIO healthy n = 22, Ob‐DIO sepsis n = 20, Ob‐KO healthy n = 12, Ob‐KO sepsis n = 14. *P < 0.05 between septic mice and healthy controls; § P < 0.05 compared with lean healthy mice; % P < 0.05 compared with healthy Ob‐DIO mice.
