
Figure 5.
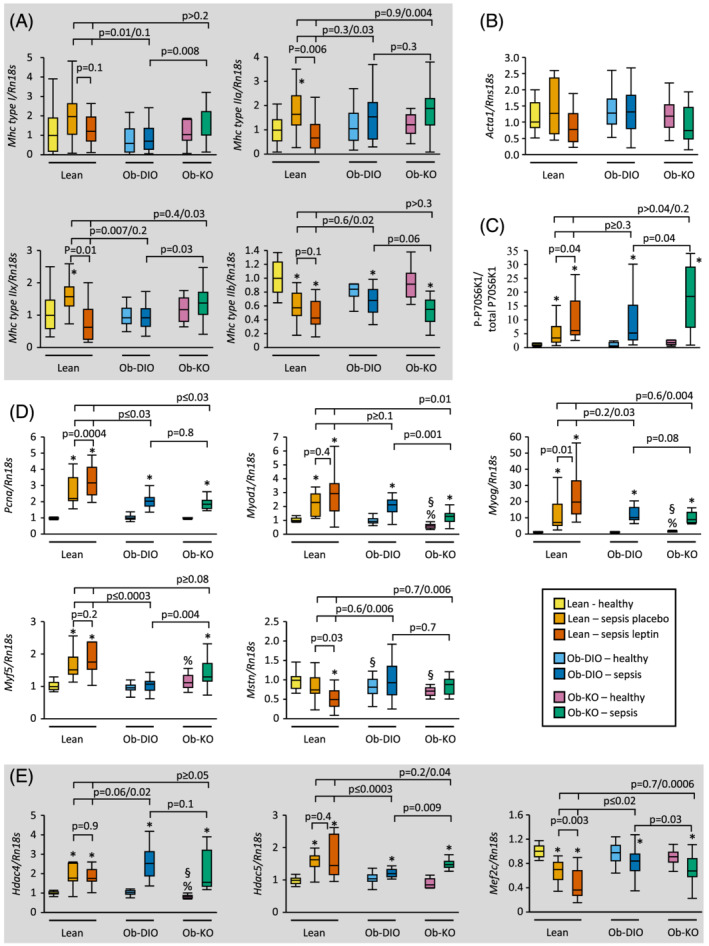
Muscle protein synthesis, growth, and regeneration. Relative mRNA expression of myosin isoform (Kruskal–Wallis P ≤ 0.02) (A) and actin (Kruskal–Wallis P = 0.07) (B) in gastrocnemius muscle (GNM). (C) Phosphorylated P70S6K1 over total P70S6K1 protein expression in GNM (Kruskal–Wallis P < 0.0001). (D, E) Relative mRNA expression of markers of muscle growth and regeneration in GNM (Kruskal–Wallis P < 0.0001). Gene expression data are shown relative the median of lean healthy mice. Lean healthy n = 17, lean sepsis placebo n = 11, lean sepsis leptin n = 14, Ob‐DIO healthy n = 22, Ob‐DIO sepsis n = 20, Ob‐KO healthy n = 12, Ob‐KO sepsis n = 14. *P < 0.05 between septic mice and healthy controls; § P < 0.05 compared with lean healthy mice; % P < 0.05 compared with healthy Ob‐DIO mice.