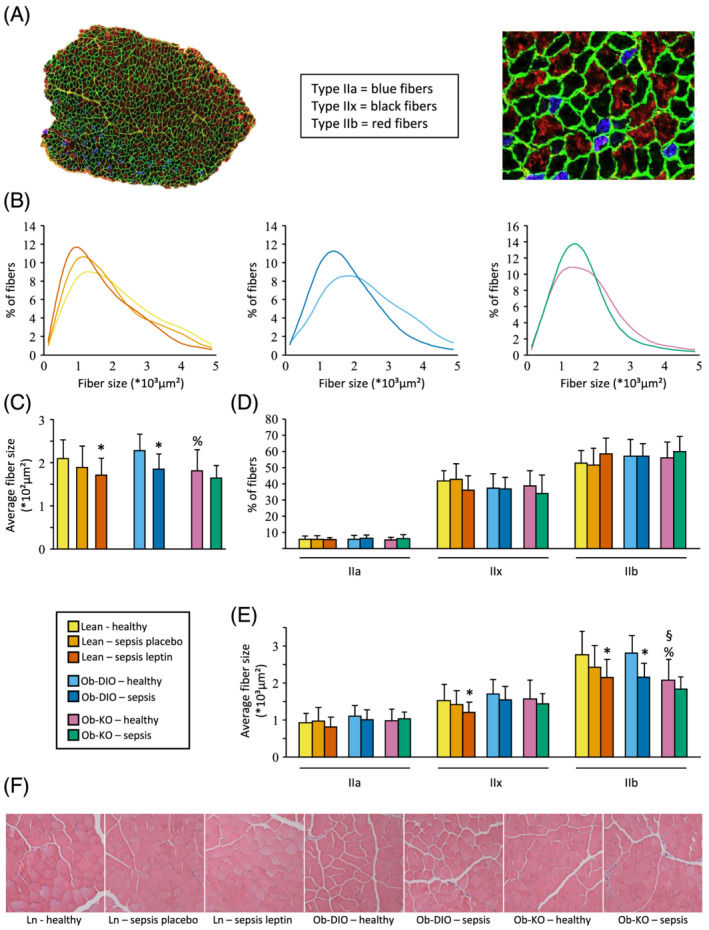
Figure 6.

Tibialis anterior muscle histology analysis. (A) Tibialis anterior section stained for muscle fibre types and laminin; type I fibres were only sporadically present and were omitted in the analyses. (B) Frequency histograms showing the distribution of cross‐sectional areas (mm2). (C) Average fibre size area for all fibres (Kruskal–Wallis P = 0.0006). (D) Percentage of fibres expressing myosin heavy chain types IIA, IIB, and IIX proteins (Kruskal–Wallis P ≥ 0.15). (E) Average fibre size area splitted by fibre type. Type IIa Kruskal–Wallis P = 0.09; type IIx and IIb Kruskal–Wallis P ≤ 0.02. (F) Representative H&E staining showing no morphological differences between groups. Lean healthy n = 17, lean sepsis placebo n = 11, lean sepsis leptin n = 14, Ob‐DIO healthy n = 22, Ob‐DIO sepsis n = 20, Ob‐KO healthy n = 12, Ob‐KO sepsis n = 14. *P < 0.05 between septic mice and healthy controls; § P < 0.05 compared with lean healthy mice; % P < 0.05 compared with healthy Ob‐DIO mice.
