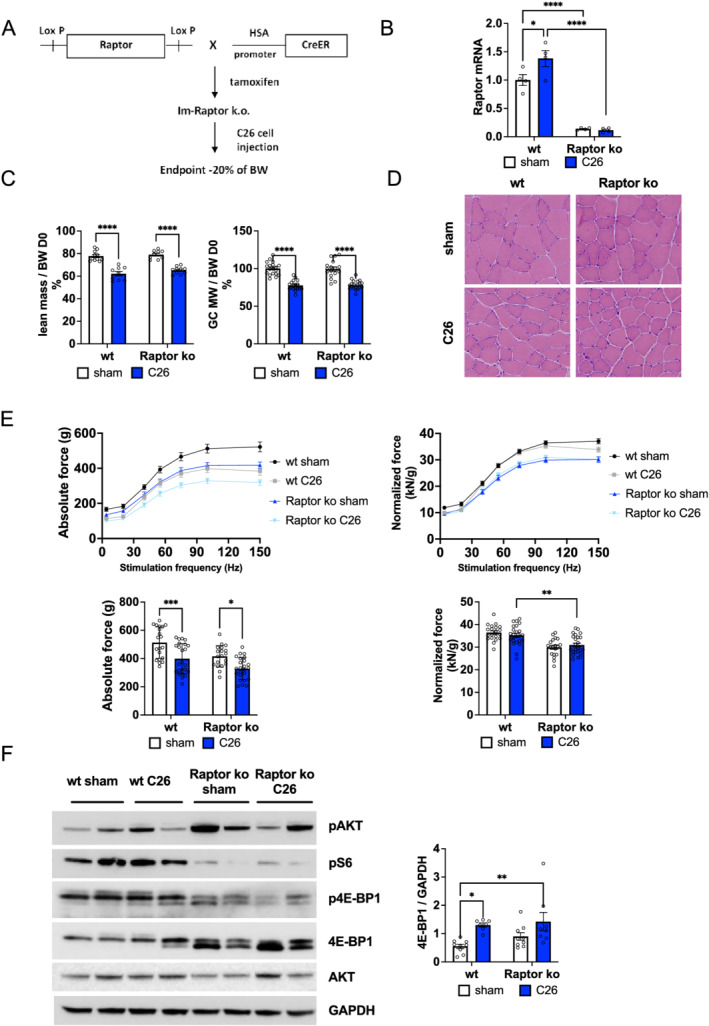
Figure 2.

Characterization of tumour‐bearing Raptor ko mice. (A) Schematic representation of the experimental procedure: after inducible muscle‐specific deletion of Raptor gene through tamoxifen treatment, C26 cells were injected subcutaneously on the back of mice. Mice were sacrificed when they lose about 20% of body weight, generally 14 days after C26 cell inoculation. (B) Gene expression of Raptor in GC muscles for Raptor ko mice during cancer cachexia; data shown as expression relative to wt sham (Raptor gene: n = 4 per group). (C) Final lean mass, measured as total body mass minus fat mass, and gastrocnemius weight in Raptor ko tumour‐bearing mice do not change with respect to wt C26 mice (lean mass Raptor ko: n = 10 per group; GC weight Raptor ko: n = 18 per group). (D) Representative H&E staining of TA muscle in C26 Raptor ko mice and controls. (E) Absolute and normalized muscle force of GC muscle in Raptor ko C26 and sham mice and histogram of tetanic force at 100 Hz (n = 20 muscles, n = 10 mice for wt and Raptor ko sham; n = 24 muscles, n = 12 mice for wt and Raptor ko C26). (F) Representative western blot analysis of mTOR signalling in Raptor ko C26 mice and 4E‐BP1 quantification in Raptor ko C26 and sham mice (4E‐BP1: n = 9 per group). Data presented as mean ± SEM. Two‐way ANOVA with Tukey's multiple comparison post hoc test was performed. *P < 0.05, **P < 0.01, *** P < 0.001, and **** P < 0.0001.
