
Figure 1.
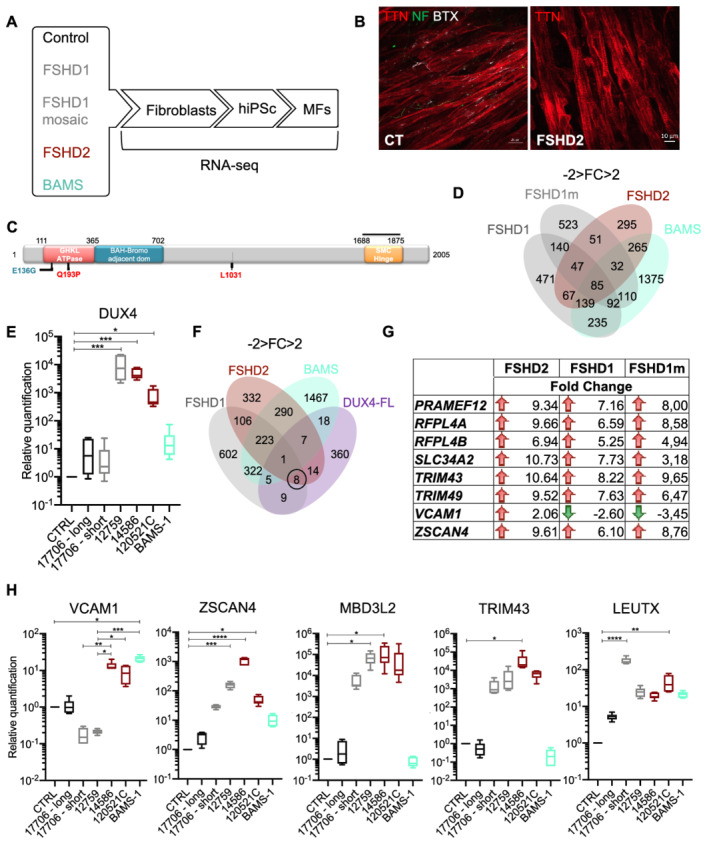
Bosma arhinia and microphthalmia (BAMS) and facioscapulohumeral dystrophy (FSHD) patient's cells progenies express the pathogenic DUX4‐fl transcript and DUX4 target genes. (A) Schematic overview of the samples used and steps of analysis. Induced pluripotent stem cells (hiPSCs) were derived from primary fibroblasts from healthy donors, patients affected with Type 1 FSHD (one FSHD1 patient carrying 7 D4Z4 repeated units (12759) and one patient with mosaicism [25% of the cells carry a 4qA allele with 2 D4Z4 repeated units; 75% of cells carry a 4qA allele with 15 D4Z4 repeated units (17706)], FSHD2 (14586; c.573A>C; p.Q193P), BAMS (BAMS‐1; c.407A>G, p.E136G) (Table S1). 13 Fibroblasts were reprogrammed into human induced pluripotent stem cells (hiPSCs), for FSHD1 mosaic cells, hiPSCs clones carrying the contracted D4Z4 or the healthy D4Z4 allele were isolated separately. Cells were described in Dion et al. 13 All hiPSCs clones were differentiated into functional muscle fibres (MFs). Gene expression analysis was performed by high‐throughput RNA‐sequencing. For each condition, two biological replicates corresponding to two independent differentiation experiments were used. DEGs were selected based on a minimum two‐fold change and statistical significance of FDR, compared with control cells. In complement to classical RNA‐Seq pipeline analysis, we applied MOGAMUN, a recently developed algorithm aimed at revealing active modules in multiplex biological networks. (B) Representative Z stacks of muscle fibres stained for Titin (TTN, red), neurofilament (NF, green), and acetylcholine receptors (AChR) using alpha bungarotoxin coupled with Alexa 555 (White) in control cells or FSHD2 cells at Day 30 post‐differentiation. (C) Schematic representation of the SMCHD1 protein and position of mutations in BAMS (cyan) or FSHD2 patients (red). BAMS‐1 (E136G) carries a missense mutation in the ATPase domain reported as a gain of function. FSHD2 patient #14586 carries a mutation in the ATPase domain (Q193P) reported as a loss of function in the ATPase activity. FSHD2 samples #12051C carrying a synonym mutation at position p.1031 was used as additional control for validation. (D) Venn diagrams for comparison of genes that are differentially expressed in FSHD1, FSHD2 and BAMS MFs compared with controls with a fold‐change −2 < FC > 2 and an FDR < 0.05 in. (E) Analysis of DUX4 expression in the different samples by RT‐qPCR. (F) By comparing our list of DEGs in FSHD1, FSHD2, or BAMS vs. control MFs with DUX4 target genes, only 1 gene, OAS2 (encoding the 2′‐5′‐oligo adenylate synthetase 2), is common between FSHD1, FSHD2, and BAMS MFs, 9 DUX4 target genes are specifically deregulated in FSHD1 MFs, 14 in FSHD2 MFs and 18 in BAMS MFs; 8 are common to FSHD1 and FSHD2. DUX4 target genes that are differentially expressed are listed on the right of the Venn diagram. (G). DUX4 target genes that are differentially expressed in FSHD1, FSHD1 mosaic, and FSHD2 MFs. Red arrows correspond to genes that are up‐regulated and green arrows, to down‐regulated genes. The fold change is indicated for all of them. (H) Validation by RT‐qPCR of DUX4 and selected DUX4 target genes, ZSCAN4 (zinc finger and SCAN domain containing protein 4), MBD3L2 (methyl CpG binding domain protein 3 L2), TRIM43 (tripartite motif containing 43), LEUTX (leucine twenty homeobox), VCAM1 (vascular cell adhesion molecule 1) expression in MFs. Box plots display the results of biological and technical triplicates for each group of samples [controls, FSHD1 short corresponds to the clone containing the contracted D4Z4 allele for the mosaic patient (17706) and FSHD1 long corresponds to its isogenic control; FSHD1 (12759) FSHD2 (14586; 120521C) and BAMS‐1]. Statistical significance was determined using a Kruskal–Wallis statistical test. *P value <0.05, **P value <0.005, ***P value <0.0005, and ****P value <0.00005.