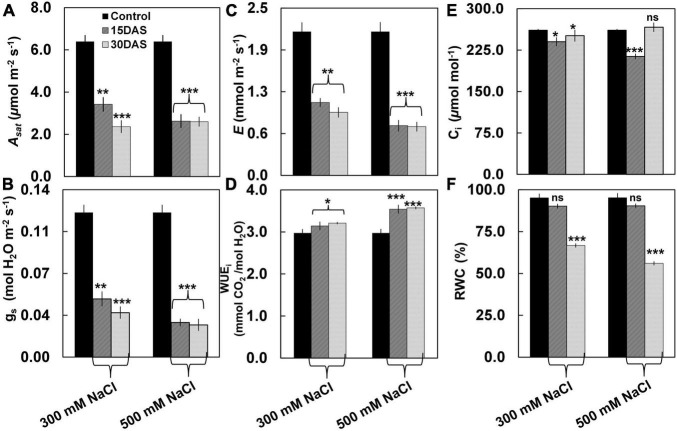
FIGURE 2.
Effect of salinity stress on leaf photosynthetic performance of P. pinnata. Variations in (A) light-saturated net photosynthetic rate (Asat) (μmol m–2 s–1), (B) stomatal conductance (gs) (mol H2O m–2 s–1), (C) transpiration rate (E) (mmol m–2 s–1), (D) instant water use efficiency (WUEi) (mmol m–2 s–1), (E) intercellular CO2 (Ci) (μmol m–1), and (F) relative water content (RWC) in P. pinnata grown under control and salt treatment conditions. Error bars represent the mean ± SD (n = 4). Two-way analysis of variance (ANOVA) test was performed to measure P-values ns, not significant; *, P < 0.05; **, P < 0.01; and ***, P < 0.001.

