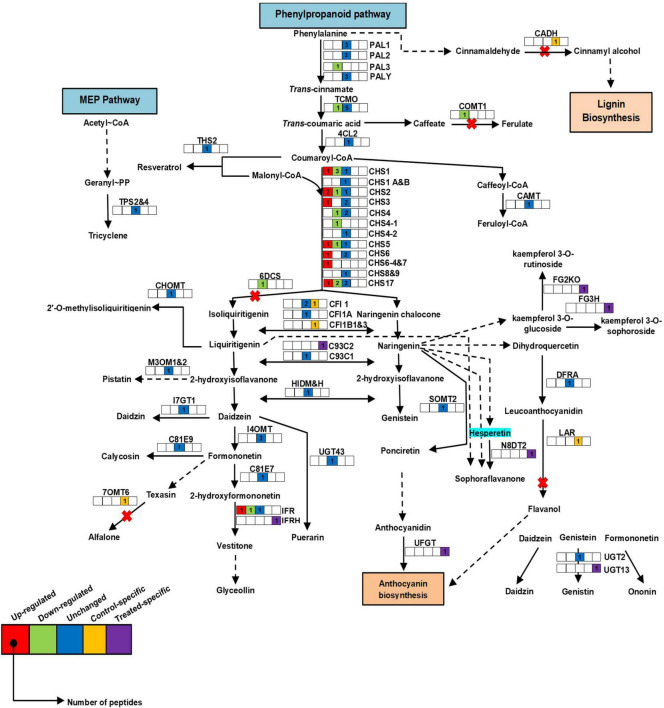
FIGURE 6.
Schematic representation of secondary metabolic pathway in roots of P. pinnata. Relative expression of protein species related to the phenylpropanoid pathway. Color key represents fold expression, and number indicates identified peptides: red color: high abundant protein species; green color: low abundant protein species, blue color: unchanged protein species; yellow color: control specific protein species; violet color: treated specific protein species. CHS, chalcone synthase; PAL, phenylalanine ammonia lyase. For protein abbreviations, see Supplementary Table 1.

