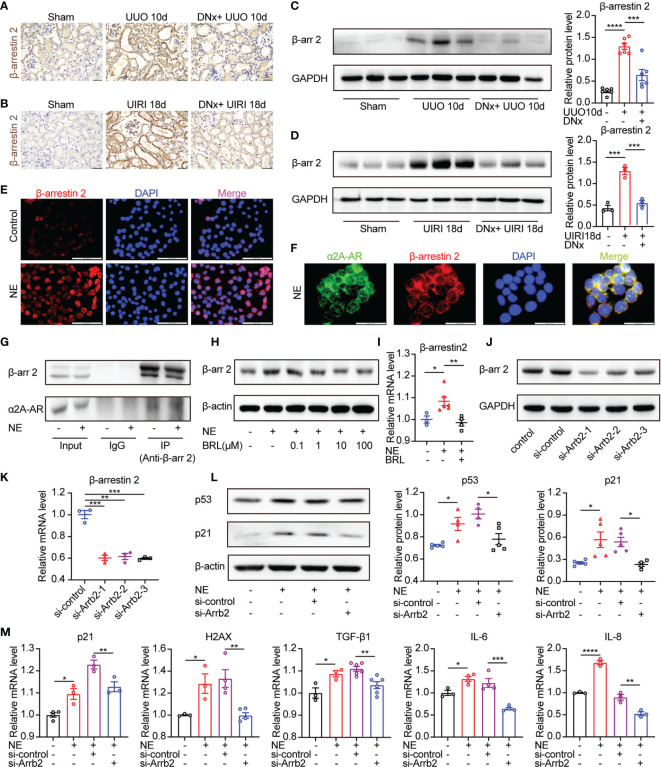
Figure 6.
β-arrestin2 is a target of α2A-AR and knockdown of β-arrestin2 ameliorates NE-induced tubular cellular senescence. (A, B) Renal denervation (DNx) or sham operation was performed 2 days before UUO or UIRI in the left kidneys of mice. Representative images of immunohistochemistry for β-arrestin2 in sham-operated, UUO/UIRI mice, and DNx+UUO/UIRI mice. Scale bar, 20 μm. (C, D) Representative Western blotting of β-arrestin2 (β-arr2) in sham-operated, UUO/UIRI, and DNx+UUO/UIRI kidneys with densitometry analysis (n=3–6 in each group). (E–G) TKPTS cells were cultured with PBS or NE (10 nM) for 48 hours. (E) Representative images of immunofluorescence for β-arrestin2 in each group. Scale bar, 20μm. (F) Cells were double-labeled with α2A-AR (green) and β-arrestin2 (red), and cell nuclei were enhanced by staining with DAPI (blue). Colocalization of α2A-AR (green), and β-arrestin2 (red) was visualized as yellow in merged images. Scale bar, 20μm. (G) Interactions between β-arrestin2 and α2A-AR were examined by immunoprecipitation (IP) with an anti-β-arrestin2 antibody, followed by immunoblotting (IB) with anti-α2A-AR antibodies. (H, I) After an hour of pretreatment with PBS or BRL4408, TKPTS cells were stimulated with NE (10 nM) for 48 hours. (H) Representative Western blotting of β-arrestin2 (β-arr2) in TKPTS cells treated with PBS, NE, and NE+BRL (100 nM, 1 μM, 10 μM, and 100 μM) (n=3 in each group). (I) mRNA expression of β-arrestin2 in PBS, NE, and NE+BRL (10 μM)-treated TKPTS cells as measured by qRT-PCR analysis (n=3–6 in each group). (J, K) TKPTS cells were transfected with scrambled siRNA or three β-arrestin2 siRNAs (si-Arrb2-1, si-Arrb2-2, or si-Arrb2-3) for 48 hours. β-arrestin2 (β-arr2) expression was examined by Western blot analysis (J) and qRT-PCR analysis (K) (n=3 in each group). (L, M) TKPTS cells were transfected with scrambled siRNA (si-control) or β-arrestin2 siRNA (si-Arrb2) 24 hours before NE (10 nM) treatment. Representative Western blotting of p53 and p21 in each group with densitometry analysis (L) (n=4–5 in each group). mRNA expressions of p21, H2AX, TGF-β1, IL-6, and IL-8 were tested by qRT-PCR analysis (M) (n=3–6 in each group). *P < 0.05, **P < 0.01, ***P < 0.001, ****P < 0.0001. Bars represented means ± SEM.

