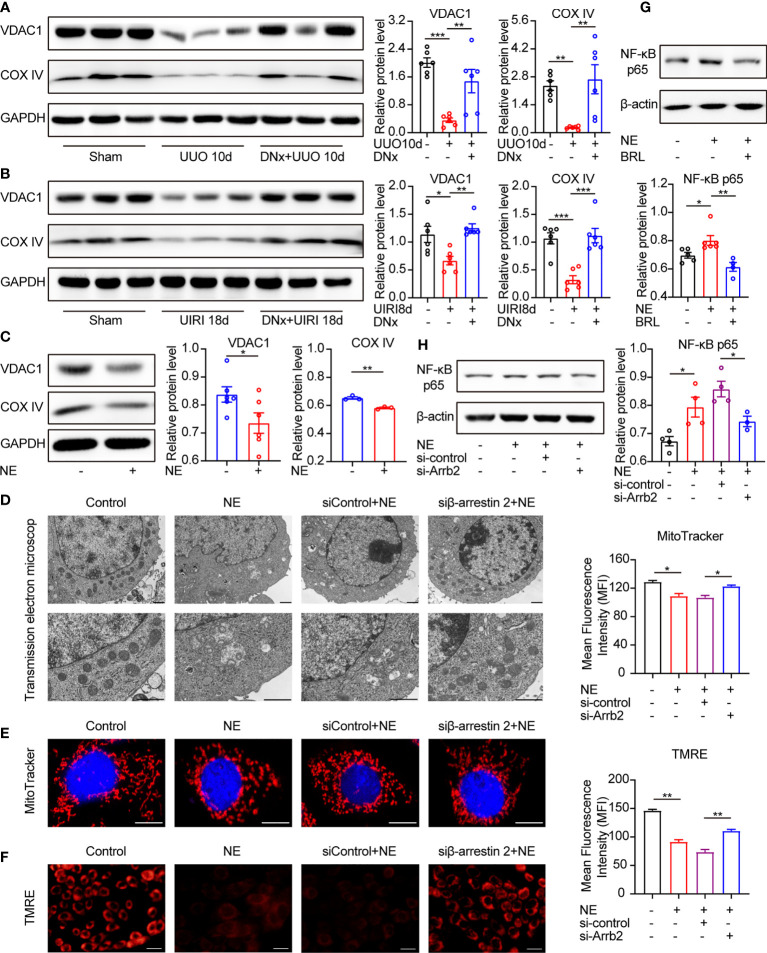
Figure 7.
α2A-AR/β-arrestin2/NF-κB signaling contributes to mitochondrial dysfunction and cellular senescence. (A, B) Renal denervation (DNx) or sham operation was performed 2 days before UUO or UIRI in the left kidneys of mice. Representative Western blotting of VDAC1 and COX IV in each group with densitometry analysis (n=6). (C) Representative Western blotting of VDAC1 and COX IV in TKPTS cells treated with PBS or NE (10 nM) for 48 hours with densitometry analysis (n=3–6 in each group). (D–F) TKPTS cells were transfected with scrambled siRNA (si-control) or β-arrestin2 siRNA (si-Arrb2) for 24 hours and then incubated with NE (10 nM) for 48 hours. Mitochondrial ultrastructure was observed by transmission electron microscope (D). Scale bar, 1 μm. Mitochondrial mass was tested by MitoTracker deep red probe (100nM) staining (E). Scale bar, 50 μm. Mitochondrial membrane potential was examined by TMRE fluorescent dye (200 nM) (F). Scale bar, 20 μm. (G) Representative Western blotting of NF-κB p65 in TKPTS cells incubated with PBS, NE, and NE+BRL (10 μM) with densitometry analysis (n=4–6 in each group). (H) Representative Western blotting of NF-κB p65 in TKPTS cells of PBS, NE, and NE+si-control, NE+si-Arrb2 with densitometry analysis (n=3-4 in each group). *P < 0.05, **P < 0.01, ***P < 0.001. Bars represented means ± SEM.

