
Figure 3.
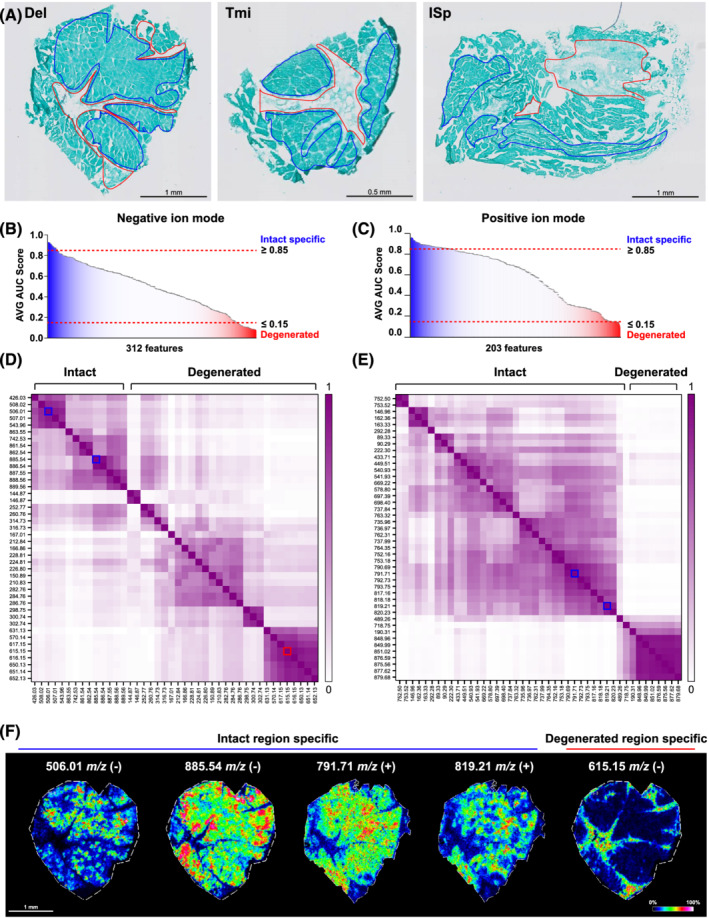
The mass spectra differ between intact and degenerated regions. (A) Manual annotation of intact (blue) or degenerated (red) regions in trichrome‐stained samples are shown for representative Del, Tmi and ISp. (B–C) ROC analysis for the intact muscle regions vs. degenerated muscle regions comparison for negative (B) and positive ion (C) mode MALDI‐MSI. AVG AUC scores of ≥0.85 are considered to be intact muscle‐specific features (presented in dark blue) and AVG AUC score ≤ 0.15 are degenerated muscle‐specific features (presented in dark red). (D–E) Heatmaps of Pearson correlation matrix of the region‐specific features between intact and degenerated regions. Panel (D) is negative mode (n = 42); panel (E) is positive mode (n = 48). Five features are highlighted as examples with blue (intact) or red (degenerated) lines. (F) Images show spatial distribution of four intact (indicated with blue line) and one degenerated (red line) enriched features in a representative muscle. AUC, under the curve.