
Figure 5.
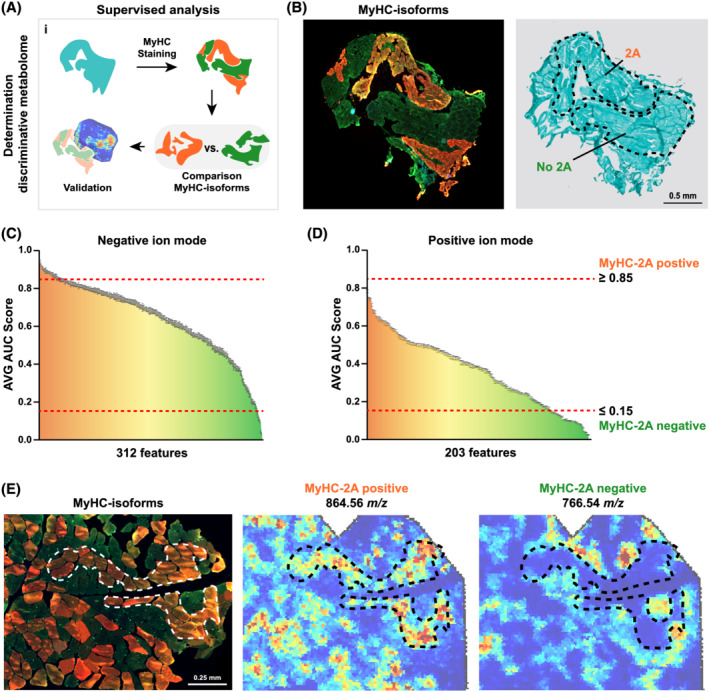
Spatial distribution of myofiber‐isotype‐specific features. (A) Cartoon presents the applied workflow. Tissue sections were first stained for MyHC‐isoforms, which was sequentially used to annotate the different MyHC‐isoforms. Next, a comparison between the MyHC‐2A‐positive and MyHC‐2A‐negative myofibers was performed to identify MyHC‐isoform‐specific features, which was followed by validation. (B) An example of myofiber type regions and the corresponding Trichome staining (right panel). MyHC‐2A‐positive or MyHC‐2A‐negative regions are gated with dashed lines. Scale bar is 0.5 mm. (C)–(D). ROC analysis for the comparison of MyHC‐2A‐positive vs. MyHC‐2A‐negative myofibers for negative and positive ion mode, panels (C) and (D), respectively. Features with AVG AUC score of ≥0.85 are considered to be MyHC‐2A specific (presented in dark orange) and AVG AUC score ≤ 0.15 are specific to other MyHC‐isotypes (presented in dark green). Features that are coloured yellow could be hybrid specific. (E) Immunofluorescence image shows a merged image of MyHC type‐1 in blue, type‐2X in green and type‐2A in red. Spatial distributions of 864.56 and 766.54 m/z show a MyHC‐2A‐independent or MyHC‐2A‐dependent expression in an example muscle. Dashed lines indicate MyHC‐2A‐positive regions.