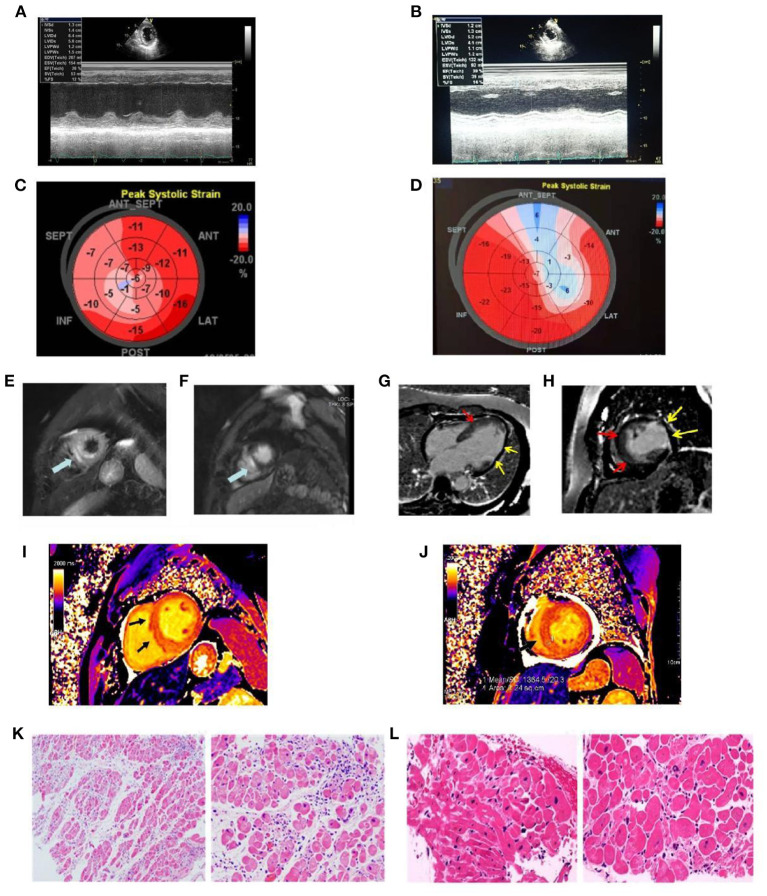
Figure 3.
The echocardiographic and cardiac magnetic resonance images recorded at admission and the findings of pathological specimens compatible with fulminant myocarditis. (A) LV ejection fraction was mildly reduced (EF value, 28%); (B) LV ejection fraction was mildly reduced (EF value = 30%); (C) Representative images of global longitudinal strains (GLS) presented as “bullseye” displays in case 1 (GLS = −12.1%); (D) Representative images of global longitudinal strains (GLS) presented as “bullseye” displays in case 2 (GLS = −9.8%); (E) Increased myocardial signal in the outer layer of the apical ventricular septum (edema) (arrow); (F) Late gadolinium enhancement imaging suggests myocardial enhancement in the outer layer of the apical ventricular septum (myocardial necrosis) (arrow); (G) Long-axis late gadolinium enhancement imaging suggests myocardial necrosis in the middle ventricular septum (red arrow), thinning, and enhancement of the lateral wall (yellow arrow); (H) Short axial late gadolinium enhancement imaging demonstrates myocardial necrosis in the middle ventricular septum (red arrow) with thinning of the lateral wall and formation of fibrosis (yellow arrow); (I) in T1 mapping, ventricular septal myocardial edema was observed, and the value of myocardial T1 was significantly increased, T1=1380 ms (normal value T1 = 1,180 ± 20 ms); (J) Myocardial edema in the lower interventricular septum was observed in T1 mapping, and the value of myocardial T1 was significantly increased, T1 = 1,364 ms (normal value T1 = 1,180 ± 20 ms); (K) Biopsy from myocardium showing myocardial fibers were slightly edematous and interstitial edema was accompanied by infiltration of inflammatory cells; (L) Biopsy from myocardium showing myocardial atrophy, hypertrophy of some cardiomyocytes, myocardial interstitial edema, local fibrosis, scattered focal necrosis of cardiomyocytes accompanied by infiltration of inflammatory cells.

