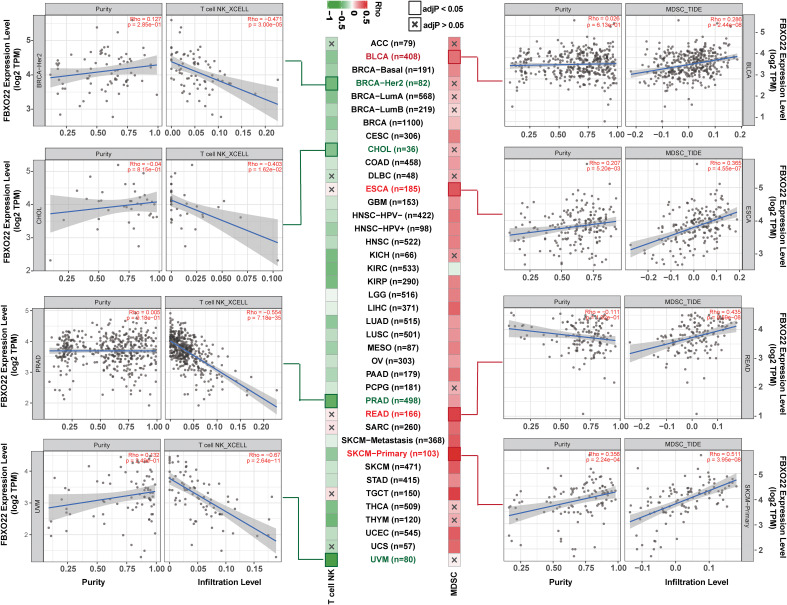
Figure 6.
Natural killer (NK) T-cell and myeloid-derived suppressor cells (MDSCs) in different tumor tissues from TCGA. The correlation between FBXO22 expression and NK T-cell infiltration levels was estimated using XCELL algorithms, and the MDSC infiltration levels were estimated using TIDE algorithms.

