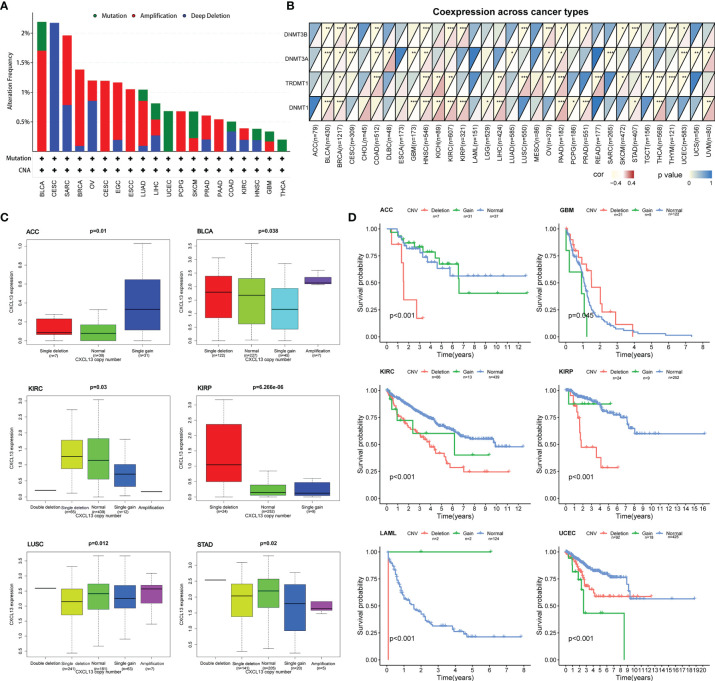
Figure 11.
Correlation between CXCL13 expression levels and CXCL13 mutation, CNV, and DNA methyltransferase. (A) The mutation features of CXCL13 for the TCGA tumors using the cBioPortal database. (B) The correlation between CXCL13 expression level and DNA methyltransferase. (C) The correlation between CXCL13 expression level and CXCL13 CNV. (D) The correlation between CXCL13 CNV and overall survival. *P < 0.05, **P < 0.01, ***P < 0.001.

