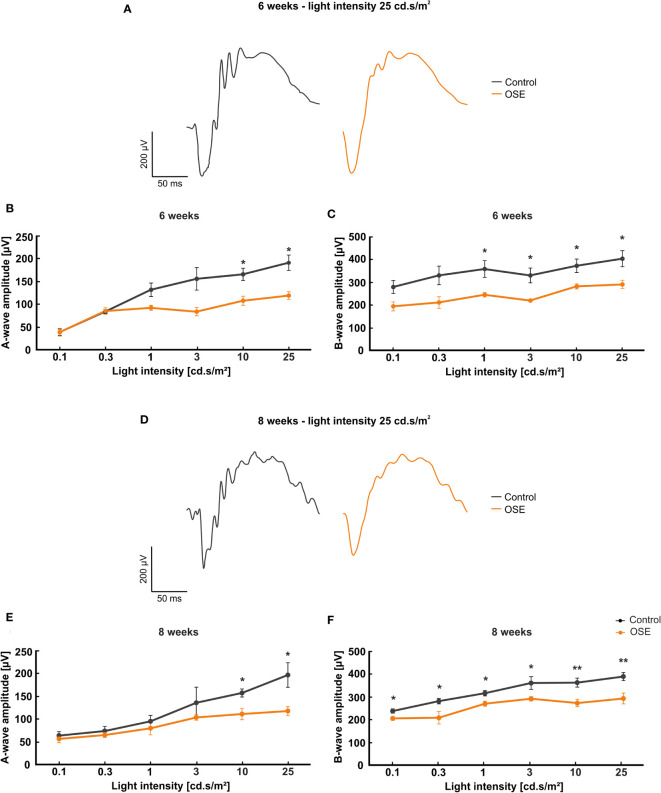
Figure 2.
Functional impairment of the retina. (A) Exemplary ERG amplitudes at 25 cd.s/m2 flash luminance at six weeks. (B) At six weeks, the a-wave amplitude, representing the photoreceptors, was reduced in the OSE group. (C) The b-wave amplitude, which illustrates the conductivity of the inner retinal layers, was significantly reduced in OSE animals in comparison to the control group. (D) Exemplary ERG amplitudes at a flash luminance of 25 cd.s/m2 in eight-week-old mice. (E) The ERG measurements after eight weeks again displayed a reduced a-wave amplitude in OSE. (F) Also, a loss of the electrical output was noted after eight weeks regarding the b-wave amplitude of OSE mice. Data are shown as mean ± SEM. *p < 0.05, **p < 0.01.

