Figure 6.

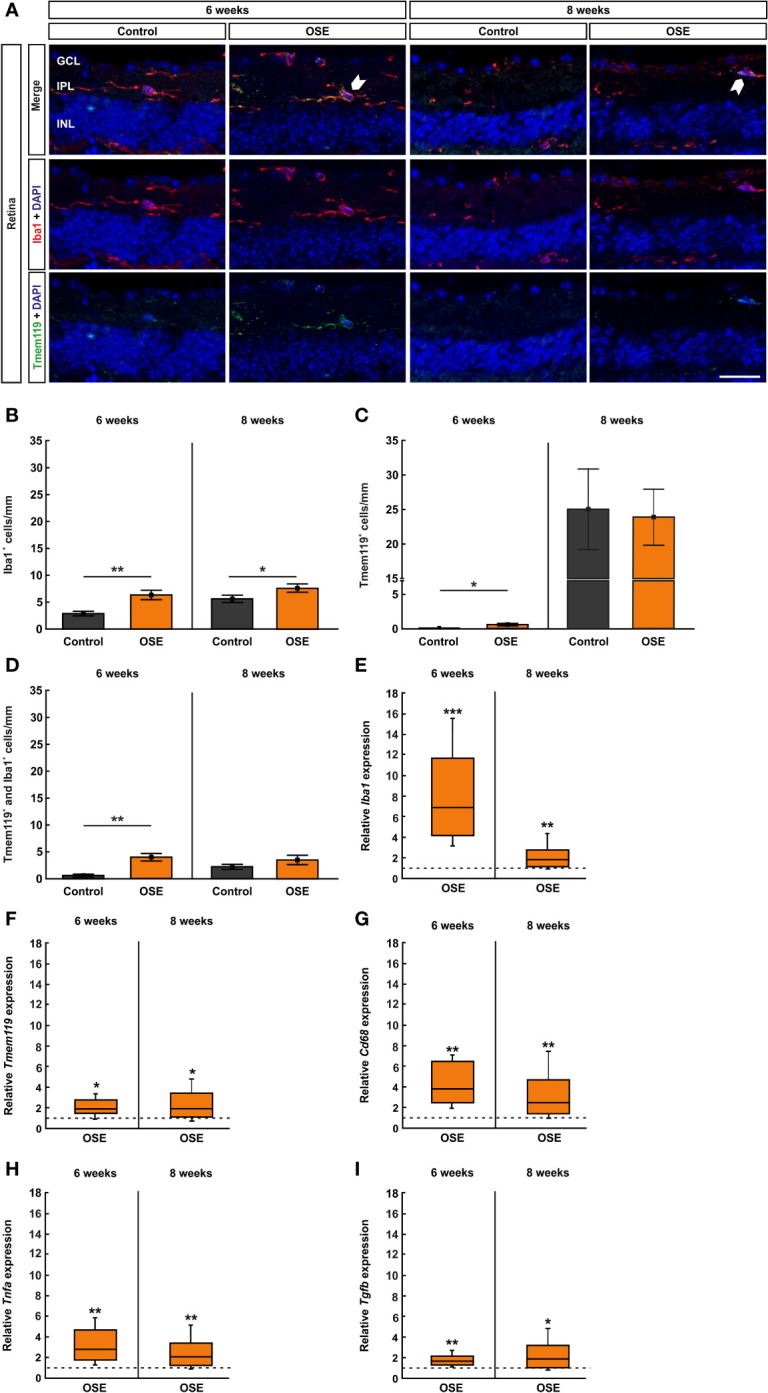
Increased number of microglia/macrophages in OSE retinae. (A) Iba1 was used to label microglia/macrophages (red) whereas microglia were co-stained with Tmem119 (green) and Iba1. Iba1+ and Tmem119+ cells were quantified in GCL, IPL, and INL. White arrows point towards co-localized Tmem119+ and Iba1+ cells. (B) The immunohistochemical staining of the retina after six weeks demonstrated a significantly increased number of microglia/macrophages (Iba1+) in OSE mice. The number of Iba1+ cells was also significantly increased in eight-week-old OSE mice. (C) An increased number of Tmem119+ cells was noted in the retinae of OSE animals at six weeks. Tmem119+ cell counts were comparable in both groups at eight weeks. (D) The number of Tmem119+ and Iba1+ cells in the retina was significantly increased in the OSE group at six weeks, which was diminished at eight weeks. (E) Using RT-qPCR, a significant upregulation of Iba1 mRNA was noticed in six-week-old OSE mice. After eight weeks, the expression of Iba1 mRNA was still significantly increased, though to a lesser extent. (F) The expression of Cd68 mRNA was significantly increased in OSE retinas at both time points. (G) The mRNA expression of Tmem119 was also elevated after six and eight weeks. (H) RT-qPCR evaluation of the cytokine Tnfa mRNA revealed an increased expression at both ages in OSE mice. (I) The Tgfb mRNA expression was significantly upregulated at six and eight weeks in the OSE group. Data are shown as mean ± SEM for immunohistochemistry, relative values for RT-qPCR are median ± quartile ± maximum/minimum. The dotted lines in (E–I) represent the relative expression level of the control group. GCL, ganglion cell layer; IPL, inner plexiform layer; INL, inner nuclear layer. *p < 0.05, **p < 0.01, ***p < 0.001. Scale bar: 20 μm.
