Figure 7.

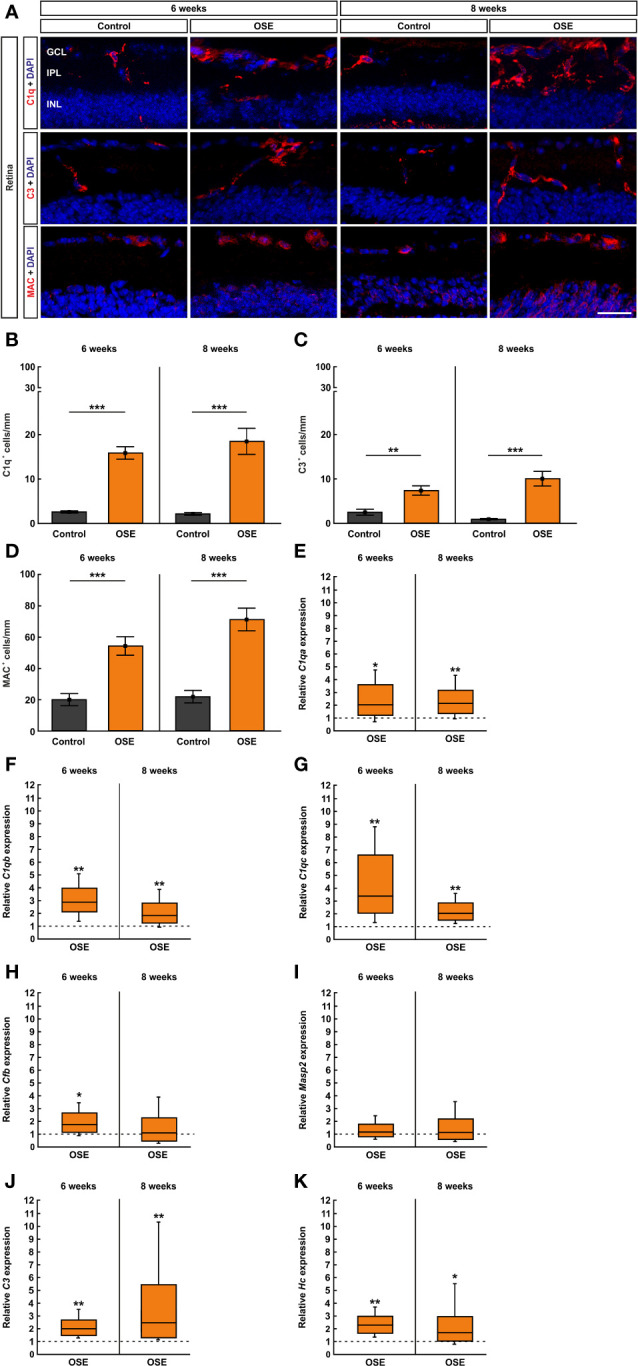
Activation of the classical pathway of the complement system in the retina of OSE mice. (A) Staining of retinal cross-sections with the complement markers C1q (red), C3 (red), and MAC (red), while DAPI counterstained cell nuclei (blue). (B) A significantly increased number of C1q+ cells was found in the OSE group in the GCL, IPL, and INL after six weeks. An increase of C1q+ cells of 16.5% was noted at the eight weeks´ time point. (C) The total number of C3+ cells in GCL, IPL, and INL was significantly elevated in six-week-old OSE mice. After eight weeks, C3+ cells were even further increased. (D) The quantification of MAC+ cells revealed a significant increase among the OSE group at six weeks. A progression of increasing MAC+ cells in OSE mice was observed after eight weeks. (E–G). Complement pathway factor C1qa, C1qb, and C1qc (classical pathway) mRNA expression were significantly upregulated in six- and eight-week-old OSE mice. (H) At six weeks of age, a significant increase of Cfb (Factor B, alternative pathway) mRNA expression was noted in OSE retinae, whereas the expression was not significantly altered later on, at eight weeks. (I) No significant differences were found in Masp2 mRNA (lectin pathway) at six and eight weeks. (J) An increased C3 (common pathway) mRNA expression was detected in the OSE group at both ages. (K) Likewise, the mRNA level of Hc (C5, common pathway) was upregulated at six as well as at eight weeks in OSE retinae. Data are shown as mean ± SEM for immunohistochemistry, relative values for RT-qPCR are median ± quartile ± maximum/minimum. The dotted lines in (E–K) represent the relative expression level of the control group. GCL, ganglion cell layer; IPL, inner plexiform layer; INL, inner nuclear layer. *p < 0.05, **p < 0.01, ***p < 0.001. Scale bar: 20 μm.
