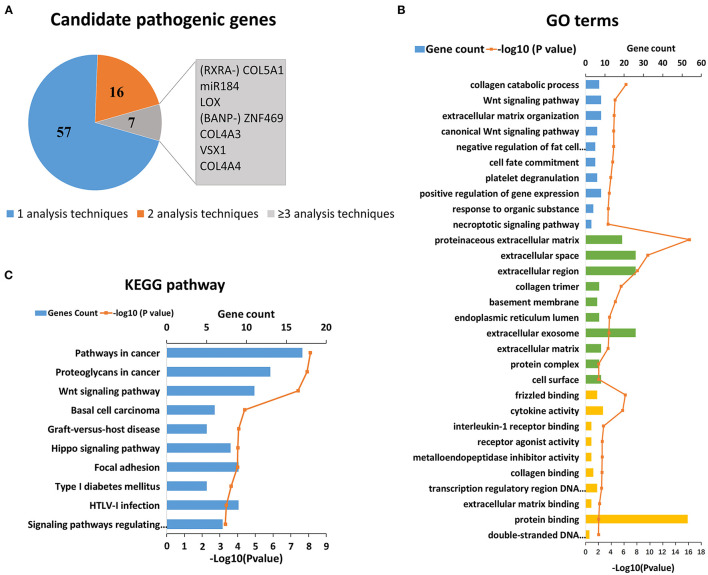
Figure 1.
Reported candidate genes in keratoconus at the DNA level. (A) The associated genes identified by different analysis techniques. (B) Top ten enriched terms of each GO category at the DNA level. The three colors represent biological process (blue), cell component (green), and molecular function (yellow), respectively. (C) Top ten enriched KEGG pathways at the DNA level.

