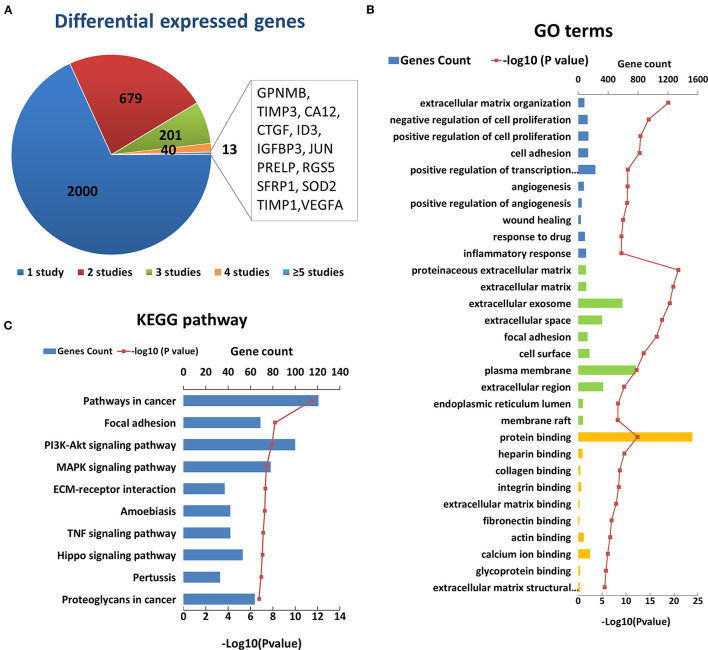
Figure 2.
Enriched GO terms and KEGG pathways based on 2933 differential genes at the transcription level. (A) The classification of the 2933 differential genes according to the number and results of related studies. (B) Top 10 enriched terms of each GO category at the transcription level. The three colors represent biological process (blue), cell component (green), and molecular function (yellow), respectively. (C) Top ten enriched KEGG pathways at the transcription level.

