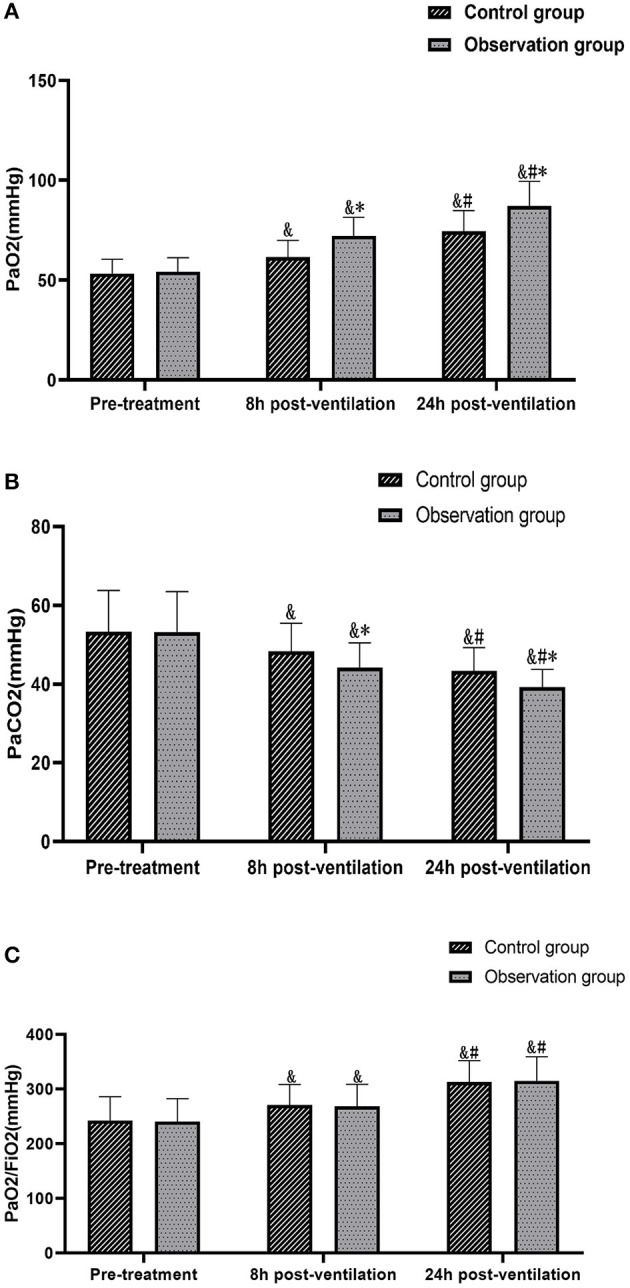
Figure 2.

Comparison of the changes in blood gas analysis values and oxygenation index between the two groups at different times. (A) Comparison of PaO2. (B) Comparison of PaCO2. (C) Comparison of PaCO2/FiO2. Compared with the same group pre-treatment, &P < 0.05. Compared with the same group 8 h post-ventilation, #P < 0.05. Comparison with control group over the same period, *P <0.05.
