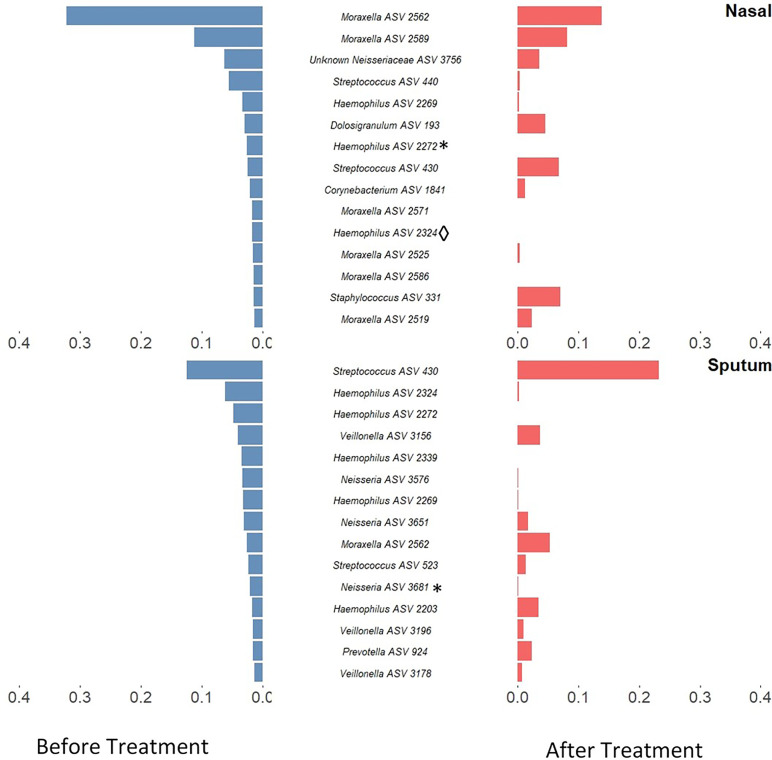
Figure 2.
Rank-abundance plots showing the 15 most abundant 16S rRNA gene ASVs in paired samples from before treatment (blue) and their respective abundance after treatment (red). ASVs are ranked based on their relative sequence abundance before treatment. Taxonomic composition was altered in both sputum and nasal samples with a notable decrease of Haemophilus ASVs in sputum samples and Moraxella in nasal samples. Those ASVs which were identified as significantly differentially abundant by DESeq2 are marked by * while those which were identified as significantly differentially abundant by LEfSE are denoted by ◊. An inverse version of this plot, whereby ASVs are ranked based on their relative sequence abundance after treatment, can be found in Figure S3 .

