Figure 2.
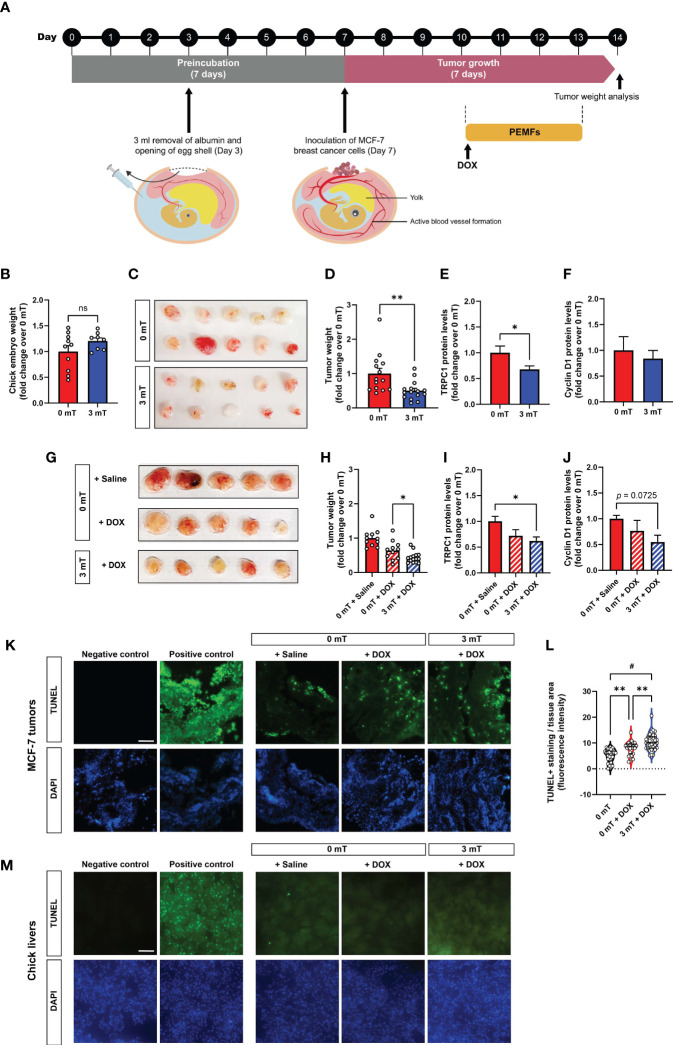
PEMF inhibits breast tumor growth in vivo correlated with depressed TRPC1 expression levels. (A) Schematic of the PEMF exposure paradigm used on the CAM model for MCF-7 breast tumor xenografts. MCF-7 tumors were inoculated onto the CAM on day 7. The tumors were either exposed to 3 mT for 1 h for 4 successive days or exposed to 3 mT after 1 h of DOX treatment (0.04 ug/g) from day 10 onwards. (B) Chick embryo weight at study termination on day 14 for both groups. (C) Representative images of MCF-7 tumor size at day 14 and corresponding quantification (D) represented as fold change over 0 mT. TRPC1 (E) and Cyclin D1 (F) expression levels normalized to GAPDH, respectively, expressed as fold change over 0 mT. (G) Representative images showing MCF-7 tumor size after treatment with the indicated conditions. Pooled data of tumor weight (H) expressed as fold change over 0 mT. TRPC1 (I) and Cyclin D1 (J) protein expression levels normalized to GAPDH and expressed as fold change over 0 mT. Measurements were minimally in triplicates, from minimally 6 independent eggs; *p < 0.05 and **p < 0.01 or as indicated. Error bars represent the standard error of the mean. (K) Representative TUNEL staining of isolated MCF-7 CAM tumors (n=4 per group) and corresponding violin-plots (L) of TUNEL fluorescence intensity. Two sections per tumor were analyzed using One-Way ANOVA and Sidak’s multiple comparisons test; **p < 0.01 and # p < 0.0001. (M) Representative micrographs of 5 chick livers per group showing TUNEL staining under the indicated conditions. Scale bar = 100 µm. TUNEL positive controls of MCF-7 tumor and liver sections were treated with DNAse prior to the staining with TUNEL. The nuclei were stained with DAPI (blue). “ns” indicates statistically nonsignificant differences.

