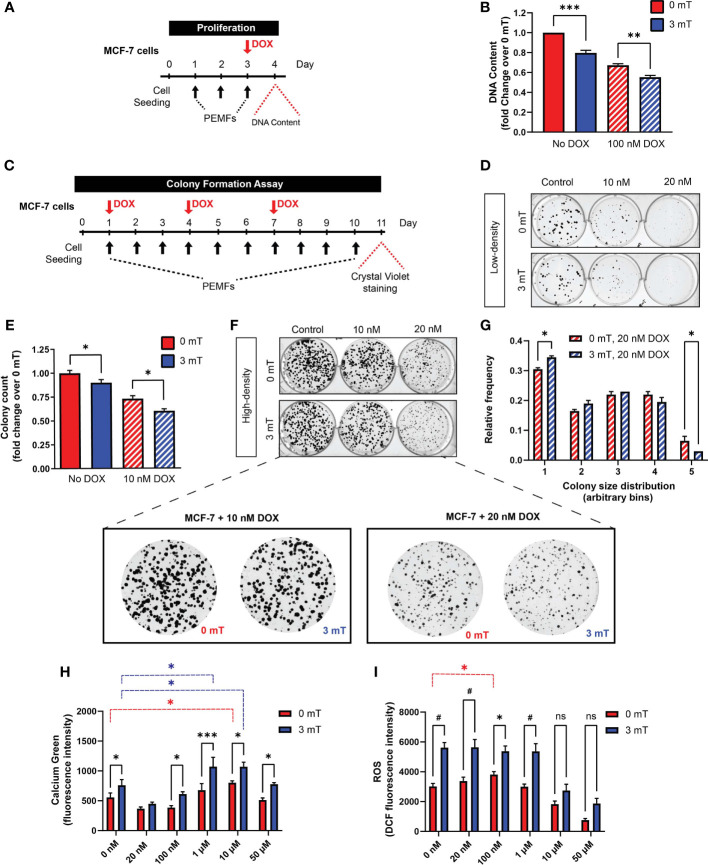
Figure 4.
PEMF exposure enhances MCF-7 cell vulnerability to doxorubicin. (A) Schematic of PEMF and DOX treatment regime for DNA quantification. Cells were exposed to 3 mT for 1 h daily for 3 successive days. DOX (100 nM) was administered on the final day 1 h before the last PEMF exposure. Cellular DNA content was measured 24 h after the last PEMF exposure. (B) Quantification of pooled data for cellular DNA content represented as fold change 24 h post-DOX and PEMF treatments. (C) Colony formation paradigm for MCF-7 cells treated with DOX and PEMFs. (D) MCF-7 colony formation in the presence of 10 and 20 nM DOX, with and without PEMF exposure, as indicated. Cells were seeded at a density of 100 per well. (E) Colony survival in 10 nM DOX under low-density conditions. Colony survival in the presence of 20 nM DOX was too low to accurately quantify. (F) MCF-7 colony formation in the presence of 10 and 20 nM DOX, with and without PEMF exposure under high-density seeding condition of 1000 cells per well. (F, below) Zoom-in images of cells under the DOX treatment paradigm. (G) Colony size frequency distribution in the presence of 20 nM DOX and 0 mT or 3 mT exposure, indicated by the red and blue hatched bars, respectively; high density cultures. (H) Absolute calcium fluorescence intensity of MCF-7 cells treated with 16 h DOX at 20 nM, 100 nM, 1 μM, 10 μM and 50 μM. Cells were loaded with Calcium Green-1 and exposed to PEMFs for 30 min before rinsing, and fluorescence determination 25 min later. (I) Absolute DCH2FDA-ROS fluorescence from MCF-7 cells. Cells were similarly treated with DOX (20 nM, 100 nM, 1 µM, 10 µM and 50 µM) for 16 h before simultaneous incubation in DCH2FDA and exposure to PEMFs for 30 min. ROS measurement was performed every hour and data presented were from the 4th hour. Calcium and ROS values represent the average of 7 technical replicates per condition. All data generated were from 3 to 5 independent experiments, with *p < 0.05, **p < 0.01, ***p < 0.001 and # p < 0.0001. The error bars represent the standard error of the mean. “ns” indicates statistically nonsignificant differences.

