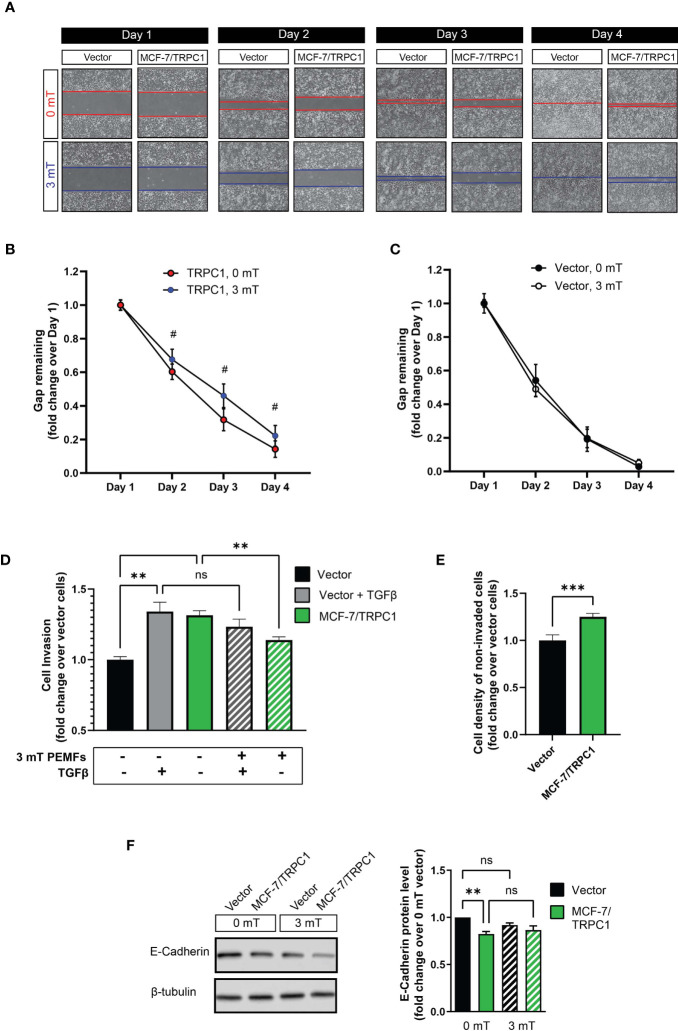
Figure 7.
PEMF exposure attenuates migration and invasion of MCF-7/TRPC1 cells. (A) Photographic comparison of the migration of vector-transfected and MCF-7/TRPC1 cells exposed to 0 or 3 mT PEMFs. Cells were plated at a density of 30,000 per well and allowed to settle for 24 h before the removal of the insert. Cells were exposed to PEMFs for 1 h on the second, third and fourth days. Time course of gap closure for (B) MCF-7/TRPC1 (0 and 3 mT) and (C) vector (0 and 3 mT) cells normalized to day 1. (D) Quantification of stained (invading) cells expressed as fold change relative to vector cells. The stained cells correspond to those that successfully invaded the basal membrane and are present on the lower side of the membrane after 48 h. Untreated vector cells served as a reference of basal cell invasion (black). Gray bars represent vector cells that had been treated with TGFβ during seeding to promote invasion in combination with (hatched) and without (solid) 3 mT PEMF exposure at seeding and 24 h later. (E) Cell density on the upper side of the insert after 48 h post-seeding. The cells were stained and lysed using the same schedule as for the invasion assay. (F) Western analysis of E-cadherin protein expression in vector and MCF-7/TRPC1 cells with and without PEMF exposure for 3 consecutive days. E-cadherin protein levels shown as fold change relative to that of 0 mT of vector cells. All results were from 3 to 5 independent experiments with **p < 0.01, ***p < 0.001 and # p < 0.0001. The error bars are expressed as the standard error of the mean. “ns” indicates nonsignificant differences.

