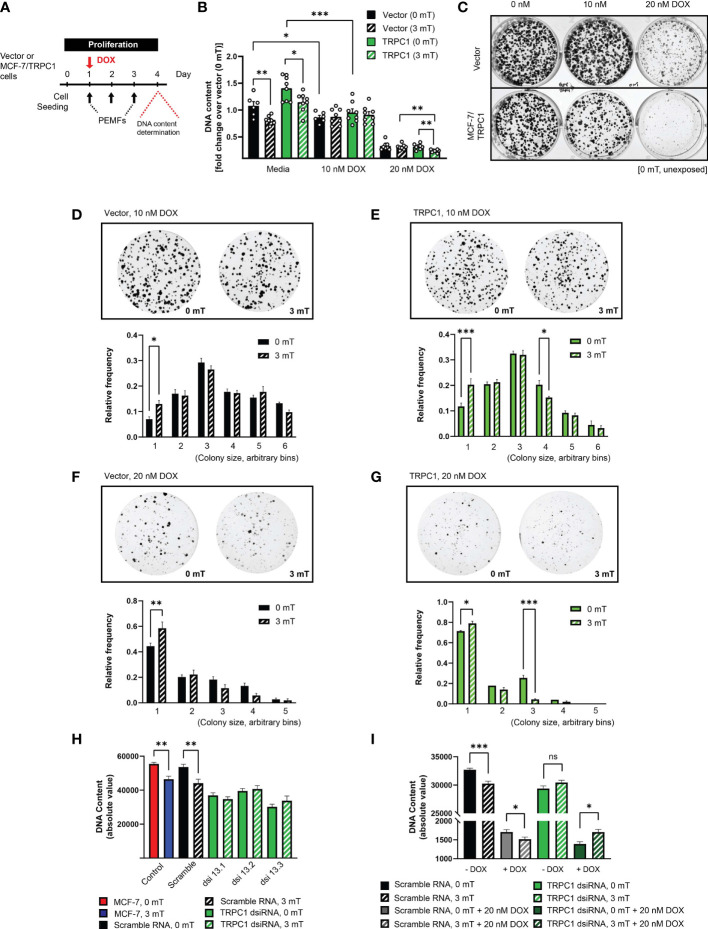
Figure 8.
TRPC1 overexpression sensitizes MCF-7 cells to doxorubicin and PEMF exposure. (A) PEMF and DOX treatment regime for MCF-7/TRPC1 cellular DNA quantification. (B) Quantification of DNA fold change relative to 0 mT vector cells. Statistical analysis was done using the two-sample t-test. (C) Colony formation after 10 days in the presence of 0 nM, 10 nM or 20 nM DOX, without PEMF exposure. Images of MCF-7 colonies and corresponding colony size frequency distributions normalized to the total number of colonies in the presence of 10 nM DOX for (D) vector and (E) MCF-7/TRPC1 cells or 20 nM DOX for (F) vector and (G) MCF-7/TRPC1 cells, concomitant with daily PEMF exposure. *p < 0.05, **p < 0.01 and ***p < 0.001 indicate the statistical difference between the respective 0 mT and 3 mT condition within the same bin. (H) PEMF-modulated growth of TRPC1-silenced MCF-7 cells 48 h post dsiRNA transfection. Cells were transfected with three independent dsiRNA (green), including a scramble RNA (black). Control (untransfected) MCF-7 cells were exposed to 0 mT (red) or 3 mT (blue) PEMFs. (I) Combined effects of PEMF and DOX (20 nM) treatments on the proliferation of TRPC1-silenced cells. Cells were exposed to PEMFs 24 h and 48 h post dsiRNA transfection before DNA content analysis (hatched bars). The data for TRPC1 dsiRNA (green and dark green) was pooled data from two independent TRPC1 dsiRNAs. The statistical analysis was generated using Multiple unpaired t-test for the comparison of two sample means within the same colony size. All experiments were from 3 to 5 independent experiments with *p < 0.05, **p < 0.01 and ***p < 0.001. “ns” indicates statistically non-significant differences. The error bars represent the standard error of the mean.

