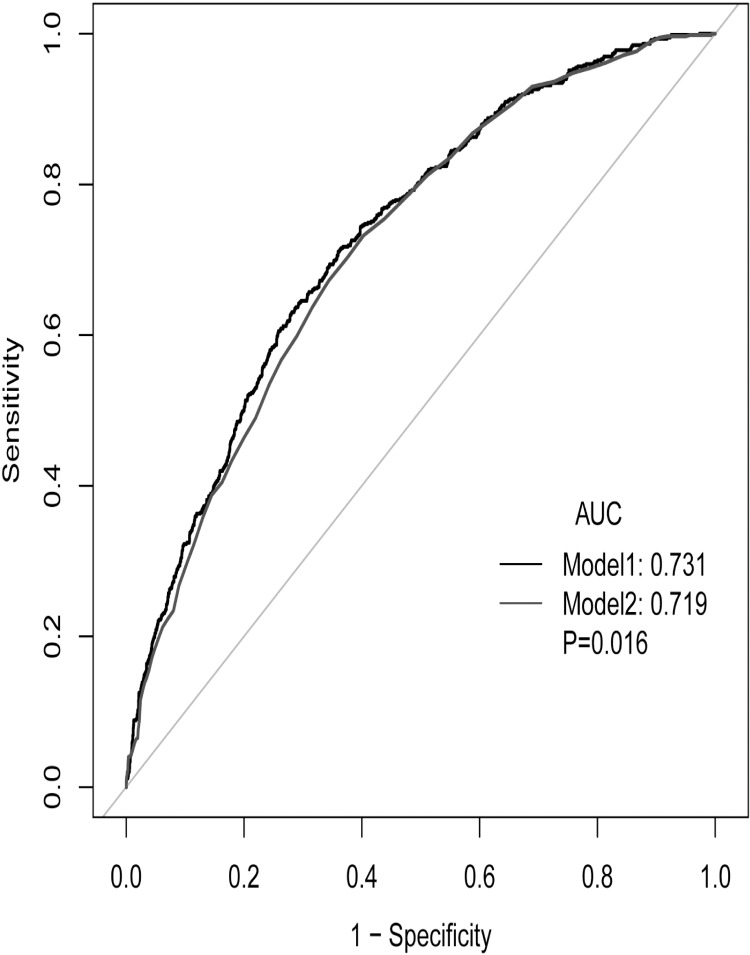
Figure 2.
ROC curve for combining SAPSII and NPAR. (Model 1: SAPSII+NPAR; model 2: SAPSII).
Note: The data came from patients in MIMIC III database.
Abbreviations: AUC, area under the curve; SAPSII, simple acute physiology score II; APSIII, acute physiology score III; NPAR, ratio of neutrophil to albumin; ROC, receiver operator characteristic curve.

