

Summary
Introgressive hybridization may play an integral role in local adaptation and speciation (Taylor and Larson, 2019). In the Mexican tetra Astyanax mexicanus, cave populations have repeatedly evolved traits including eye loss, sleep loss, and albinism. Of the 30 caves inhabited by A. mexicanus, Chica cave is unique because it contains multiple pools inhabited by putative hybrids between surface and cave populations (Mitchell et al., 1977), providing an opportunity to investigate the impact of hybridization on complex trait evolution. We show that hybridization between cave and surface populations may contribute to localized variation in traits associated with cave evolution, including pigmentation, eye development, and sleep. We also uncover an example of convergent evolution in a circadian clock gene in multiple cavefish lineages and burrowing mammals, suggesting a shared genetic mechanism underlying circadian disruption in subterranean vertebrates. Our results provide insight into the role of hybridization in facilitating phenotypic evolution.
Subject areas: Aquatic science, Evolutionary biology, Aquatic biology
Graphical abstract
Highlights
-
•
Hybridization leads to a localized difference in sleep duration within a single cave
-
•
Genomic analysis identifies coding differences in Cry1A across cave pools
-
•
Changes in Cry1A appear to be conserved in cavefish and burrowing mammals
Aquatic science; Evolutionary biology; Aquatic biology
Introduction
Hybrid zones resulting from interbreeding between lineages that occupy different environmental extremes offer a powerful means to detect targets of selection in the genome underlying complex traits. Recent advances in sequencing technology and statistical approaches have made it feasible to apply admixture mapping to identify adaptive loci underlying ecological divergence in plant and animal models of evolution (Luttikhuizen et al., 2012; vonHoldt et al., 2016; Bresadola et al., 2019; Calfee et al., 2020; Powell et al., 2020; Taylor and Larson, 2019). However, previous studies in plants and animals have focused on hybrids formed between distinct species with substantial genetic divergence and reproductive isolation, making it difficult to identify regions associated with ecologically relevant traits versus intrinsic incompatibilities (Gompert et al., 2017). The application of admixture mapping to models of trait evolution has the potential to define fundamental interactions between genetic and environmental variations that shape evolution.
The Mexican tetra, Astyanax mexicanus, is a powerful model system for investigating the genetic and evolutionary basis of development and behavior (Yoshizawa et al., 2010; Duboué et al., 2011; Bibliowicz et al., 2013; Kowalko et al., 2013; Aspirasa et al., 2015). Surface populations inhabit rivers from Texas to Mexico and have invaded caves multiple times, resulting in at least 30 populations of cave morphs in the Sierra de El Abra region of Northeast Mexico (Mitchell et al., 1977; Espinasa et al., 2020). At least two independent lineages of surface fish have invaded caves within the past ∼200,000 years (Ornelas-García et al., 2008; Herman et al., 2018). Cavefish populations have converged on numerous morphological traits that are thought to be adaptive in the cave environment, including albinism and eye loss (Moran et al., 2014). In addition, cavefish have repeatedly evolved multiple behavioral changes, including sleep loss, which may increase the time allocated to foraging in nutrient-poor cave environments (Duboué et al., 2011; Yoshizawa et al., 2015). The application of molecular genetic approaches has led to the identification of genetic factors that regulate some of these trait differences, but the mechanisms underlying their evolution remain poorly understood (McGaugh et al., 2020).
We recently found evidence of historical and contemporary gene flow between natural surface and cave populations of A. mexicanus (Herman et al., 2018). The presence of admixture between populations raises the possibility that gene flow may be a critical driver of trait evolution in this system. The Chica cave is unique in that it has been reported to contain fish that exhibit extreme levels of phenotypic variation across four pools that differ in their proximity to the cave entrance, nutrient input, and physicochemical properties (e.g., dissolved oxygen) (Figure 1A) (Bridges, 1940; Breder, 1942; Mitchell et al., 1977; Romero, 1983). It has been debated whether the fish within Chica cave represent a young cavefish population (owing to a recent invasion by surface fish) (Strecker et al., 2012) or hybrids between local cave and surface populations (Mitchell et al., 1977). Historical surveys suggested that A. mexicanus within Chica cave exhibit a morphological gradient in troglobitic traits across pools, potentially shaped by environmental variation within the cave and ongoing influx of surface and cave morphs from underground waterways that feed into the cave (Mitchell et al., 1977). Notably, the connections to both the nearby river and to other caves in the region were thought to occur deep within the cave, not at the entrance. It has also been proposed that hybridization is sustained by the enhanced nutrient load in Chica cave in the form of a large bat roost (Mitchell et al., 1977), allowing the surface fish to survive long enough to interbreed with the cavefish. Thus, this cave provides a unique natural system to examine the role of hybridization in promoting the evolution of complex traits. Here we leverage robust differences in behavior and morphology between surface and cavefish populations of A. mexicanus, combined with whole-genome sequencing, to investigate the ancestry of putative hybrids in Chica cave and to examine the genetic basis of trait variability across a heterogeneous environment.
Figure 1.

Collection locations and variation in morphological traits within and between cave populations
(A) Map of Chica cave, modified with permission from (Elliott, 2015). Pool one and Pool two are colored dark blue.
(B) Collection locations for cave and surface populations. For the two surface populations, the collection location for Río Choy is represented by a light blue circle and the collection location for Rascón is represented by a dark blue circle.
(C) Representative images of wild-caught fish. Scale bar denotes 1 cm.
(D) Representative images of eye morphology variations in Chica Pools one and two and complete eye loss in wild-caught Pachón and Los Sabinos cave populations. There are no eyed fish present in Pachón and Los Sabinos populations.
(E) Eye diameter is reduced in Chica pool two fish compared to pool 1 (p < 0.05∗, Unpaired t-test, t = 1.88, df = 17). Eye size was corrected to body length.
(F) Eye morphology in Chica fish. Chica Pool 1: observed 60% eye (n = 9), 40% no eye (n = 6). Chica Pool 2: observed 40% eye (n = 2), 60% no eye (n = 3).
(G) Pigment quantification from combined melanophore counts on standard anatomical markers following (Stahl et al., 2018) (i.e., caudal fin area, adipose fin area, dorsal area, eye cup area, anal fin area, infra-orbital area; see Figure S1) corrected for body length. Differences in melanin pigmentation are present among different populations (p < 0.001, KW statistic = 23.53, Kruskal–Wallis test with Dunn′s multiple comparison test: Chica 1 vs. Chica 2, p < 0.01∗∗; Chica 1 vs. Pachón, p < 0.001∗∗∗∗; Pachón vs. Los Sabinos, p < 0.01∗∗). NS: Not significant. See also Figures S1 and S4.
Results and discussion
We first conducted morphological and population genomic analysis to determine whether Chica fish represent hybrids between surface and cave populations. For comparison, we also collected adult fish from two nonadmixed caves in the Sierra de El Abra region, Pachón and Los Sabinos (Figures 1B and 1C; see Table S1 for sample sizes). To examine morphological variability, we phenotyped wild-caught fish for eye size and pigmentation (Mitchell et al., 1977). Eyes were absent in wild-caught fish from Pachón and Los Sabinos caves (Figures 1D and S1). In contrast, the presence or absence of eyes was highly variable in wild-caught fish from both pools within Chica cave. Overall eye diameter was significantly larger in fish from Chica Pool one compared to Pool 2 (p < 0.05, Unpaired t-test, t = 1.69, df = 17; Figure 1E). Additionally, Chica Pool one contained more fish with eyes present (n = 9; 60%) than those with no eyes (n = 6; 40%), while Chica Pool two contained fewer fish with eyes (n = 2; 40%) and increased numbers with no eyes (n = 3; 60%) (Figure 1F). Therefore, eye size (but not the frequency of fish with eyes present) varies significantly between pools within Chica cave; though, we note that power to detect significant differences is low given our sample size.
We observed low melanin pigmentation levels in all cavefish, but the number of melanophores varied among different cave populations (Figure 1G). Although a number of pigmented individuals were present within the wild-caught Pachón and Los Sabinos populations, we observed overall low levels in the variability of melanin patterns within these cave populations. Interestingly, robust differences in the number of melanophores were observed between different populations of cavefish, including between fish from different pools within Chica cave (Dunn′s multiple comparison: Chica Pool 1 > Chica Pool 2, p < 0.01; Chica Pool 1 > Pachón, p < 0.001; Los Sabinos > Pachón, p < 0.01; Figures 1G and S1). Notably, pigmentation variation within Chica cave was significantly greater than that observed within Pachón and Los Sabinos caves (Brown–Forsythe test, p = 0.03; Bartlett′s test, p = 0.04). Taken together, these findings indicate that fish from Chica cave exhibit a high degree of phenotypic variability that differs between microenvironments within the cave.
To investigate whether hybridization contributes to the observed phenotypic variability within Chica cave, we used whole-genome resequencing to conduct admixture analyses and genomic ancestry mapping. This allowed us to test for genomic evidence of hybridization and to define population structure between fish from Chica Pools 1 and 2, three other cave populations (Pachón, Los Sabinos, and Tinaja), and two surface populations (Río Choy and Rascón) (Figures 2A and 2B and S2). Our analyses revealed historical gene flow between Chica cave and the lineages represented by Río Choy surface and Tinaja cave populations (Figure 2C). Further analyses confirm that Chica cave population is a hybrid population resulting from interbreeding between the nearby surface fish (from Río Choy/Tampaón) and southern El Abra cavefish (Table S2; Figure S3), with the onset of hybridization estimated at approximately 2,000 generations ago (Figure 2D; Table S3).
Figure 2.

Genetic relationship between cave and surface populations, hybrid ancestry within Chica cave, and genetic divergence between Chica Pool one and Pool 2.
(A) ADMIXTURE barplot showing ancestry proportions for K = 5.
(B) Biplot of scores for the first two PCs from PCA on 678,637 SNPs. Note that individuals from Chica cave Pool one and Pool two overlap, and individuals from Tinaja cave and Los Sabinos cave overlap.
(C) TreeMix tree with three migration events and rooted with the outgroup, A. aeneus. New lineage surface population (Río Choy) groups with A. aeneus, and old lineage surface (Rascón) and caves (Chica and Tinaja) all group together. Migration events are present between Chica cave and the geographically close surface population, Río Choy, and between Tinaja and Chica caves. Note arrow does not necessarily denote the directionality of migration events.
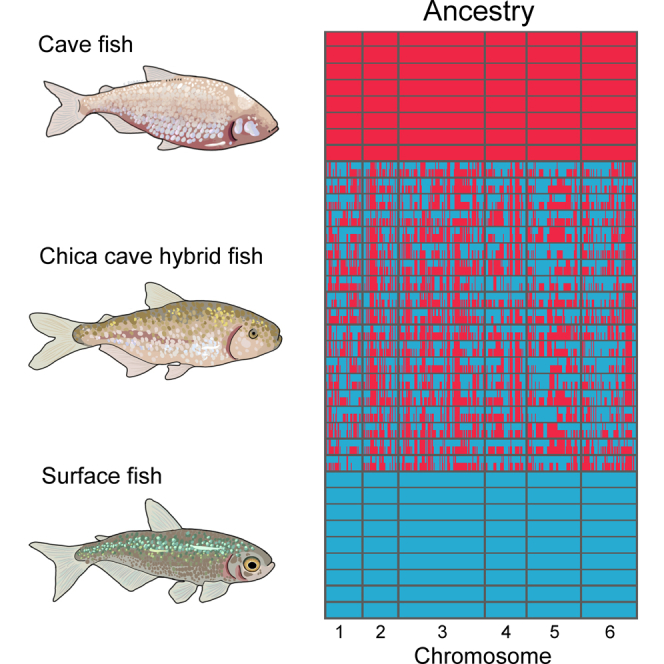
(D) Local ancestry derived from surface (Río Choy, blue) versus cave (Tinaja, red) parental populations in hybrid fish from Chica cave. Each row represents a diploid individual with two haplotypes stacked on top of one another.
(E) Absolute genetic divergence (Dxy) between fish from Chica cave Pool one versus Pool two in 50 kb windows across the genome. Of the windows with exceptionally high genetic divergence between pools (Dxy values >95th percentile), 50.96% (371 out of 728) contained a higher proportion of sites derived from the parental cave lineage (i.e., Tinaja) in Pool 2, whereas 39.56% (288 out of 728) had a higher proportion of sites derived from the parental cave lineage in Pool 1. Locations are indicated for several top candidate genes with high divergence between Chica pools and biological functions related to sleep and circadian cycle (purple), eye morphology and function (green), metabolism (orange), and pigmentation (pink), or that are pleiotropically involved in two or more of these pathways (black) (see Table S4). The 95th percentile (Dxy = 0.0034) is delimited by a horizontal line. See also Tables S1–S3 and S4 and Figures S2 and S3.
Genome-wide divergence between fish from Chica cave Pool one and Pool two is low, suggesting that gene flow is high among pools within Chica cave (Figure 2E). Average nucleotide diversity (Pi) across the genome did not differ between pools within Chica cave (Pi = 0.0021 for Chica Pool one and Pool 2; Table S1). Notably, nucleotide diversity within Chica cave was 2–3X higher compared to other caves (Table S1) and absolute genetic divergence between pools within Chica cave (Dxy = 0.0020) is comparable to that observed among other cave populations (Table S1). We observed no differentially fixed sites between Chica Pool1 and Pool 2, indicative that gene flow is ongoing. All Chica individuals exhibited highly similar proportions of the genome derived from surface versus cave parental populations (Pool one Cave Ancestry: Mean ± SE = 0.755 ± 0.004; Pool two Cave Ancestry: Mean ± SE = 0.756 ± 0.003), and the length distribution of genomic tracts derived from the surface parental population did not differ between Chica pools (Table S3). Together, this indicates that the overall amount of gene flow from the surface population does not differ significantly between pools within the Chica cave, supporting the notion that hybridization contributes to the phenotypic variability we observe within Chica cave.
Despite homogenizing gene flow between pools, analysis of sequence divergence revealed highly localized regions of genomic divergence between fish from adjacent pools within Chica cave, reflecting the morphological differences we observed between these pools (Figure 2E). In regions above the 95th percentile for Dxy between the two Chica pools, fish from Pool two were more likely to harbor alleles derived from the nearby southern El Abra cave populations (i.e., Tinaja) compared to Pool 1 (Wilcoxon rank-sum test: W = 2.6511e+13, p < 2.2e-16). We observed a positive correlation between the difference in local ancestry between pools and genetic distance between pools (Pearson′s correlation: r = 0.0012, n = 7,345,340, p = 0.0011), indicating that the greater proportion of cave ancestry maintained in Pool two compared to Pool one drives genetic differences between the pools. Together, this suggests that gene flow may be a critical driver of the identified morphological differences between pools within the same cave.
We sought to define the genes with the greatest degree of divergence (Dxy values above the 95th percentile) between the pools, as these provide candidates for evolved phenotypic differences between the individual populations (Table S4). The genes with the exceptional divergence between pools were significantly enriched for ontologies and phenotypic categories typically associated with morphological, behavioral, and physiological differences between surface fish and cavefish (Keene et al., 2015; McGaugh et al., 2020), including pigmentation (e.g., bloc1s3, cd63, sox10, meox1, asip2b, pnn, senp7b), eye development and light detection (e.g., c1qa, itgam, pde6ha, srd5a2a, opn3, mybbp1a, cdcp2, gja8a, dnase1l1l, coa6, pcare2, casp6), sensory processing by the lateral line neuromasts (e.g., rsph9, tmie), feeding behavior and metabolism (e.g., parp9, sult6b1, ins), and sleep and circadian cycling (e.g., srd5a1, mc3r, chrnb5a, galn, gna11b, cry1a, cry1b) (Fisher′s exact tests, p < 0.05; Figure 2E, Table S4). An additional independent analysis of known phenotypes associated with annotated genes in the A. mexicanus surface fish reference genome (compiled from Ensembl′s BioMart v104) corroborated the results of the GO enrichment analysis. For a gene to have an annotated phenotype in Ensembl, the ortholog from mouse, human, or zebrafish exhibited experimental evidence of impacting the specified phenotype. Phenotypic categories associated with cave adaptation (i.e., eye function and morphology, pigmentation, sleep behavior and circadian rhythm, sensory processing by neuromasts, and feeding behavior and body mass) were overrepresented in outlier genes with the exceptional divergence between Chica pools (Dxy above the 95th percentile) compared to all other genes (Fisher′s exact tests, p < 0.05; Table S4).
Many of the candidate genes with high absolute divergence between Chica pools and ontologies and phenotypes associated with traits known to be adaptive in caves (e.g., cry1a, cry1b, mc3r, srd5a1, ins, dnase1l1l, cdcp2, mybbp1a, itgam, senp7b, pnn, sox10, cd63) also fall within the top 10% of FST values across all genes (Table S4). The mean FST for all genes within the top 5% of Dxy values between Chica Pool1 and Pool 2 (mean ± SD: 0.001028 ± 0.004) was 11x greater than the mean FST for all other genes (mean ± SD: 0.00093 ± 0.0002).
To formally test for signatures of selection on outlier genes with the exceptional divergence between the two Chica pools, we used a deep convolutional neural network approach implemented in diploS/HIC (Kern and Schrider, 2018). Of all candidate genes with Dxy values in the top 5% in comparison between Chica Pool one and Pool 2, we found evidence of selection in 93% of the candidate genes in Chica Pool one and in 92% of the candidate genes in Chica Pool 2 (Table S4). Remarkably, many of these genes also fall within the top 5% of Dxy values for at least one cave and surface population comparison which do not show evidence of recent hybridization (Table S4), suggesting that these genes are strong candidates underlying the morphological differences in eye size and pigment not only within Chica cave but also across cave-surface comparisons more broadly.
One notable mutation is present in the candidate gene cryptochrome circadian regulator 1a (cry1a), a transcriptional repressor. Cryptochromes play a highly conserved role in circadian clock regulation across plants and animals (Cashmore et al., 1999) (Hirayama et al., 2019). We observed that cry1a exhibits a nonsynonymous mutation, R263Q, that is present in Chica, Tinaja, and Pachón cave populations but not in two different populations of surface fish (Río Choy and Rascón). In silico analyses of the functional impact of the variant with SIFT (Kumar et al., 2009) and VEP (McLaren et al., 2016) indicated that the R263Q mutation is predicted to be deleterious to protein function (Table S4). Residue 263 occurs within the FAD-binding domain of CRY (Beale et al., 2013; Czarna et al., 2013) (Figure 3A) and is otherwise highly conserved across plants and animals (Cashmore et al., 1999) (Figures 3B and 3C). Furthermore, a deletion in exon 6, which contains residue 263, is associated with a circadian rhythm sleep disorder (delayed sleep phase syndrome, DSPS) in humans (Emre Onat et al., 2020). Together, this evidence suggests that the R263Q mutation likely has an impact on protein function. To determine whether this mutation is unique to Astyanax cavefish, we examined an alignment of 284 CRY1 homologs across 266 animal species (including invertebrates) downloaded from Ensembl v104 and the CRY1 ortholog for the Somalian cavefish (Phreatichthys andruzzii) that was available on NCBI (GenBank: ADL62679.1). Remarkably, we found that the R263Q mutation is only present in four distantly-related cyprinid species, including three Chinese cavefish (the blind barbel Sinocyclocheilus anshuiensis, the golden-line barbel Sinocyclocheilus grahami, and the horned golden-line barbel Sinocyclocheilus rhinocerous) and the Somalian cavefish (P. andruzzii) (Ceinos et al., 2018), as well as two burrowing rodent species (the naked mole-rat, Heterocephalus glaber, and the common degu, Octodon degus) (Figure 3). It was not detected in the 278 other species with CRY1 orthologs available on Ensembl. Phreatichthys and Sinocyclocheilus cavefish have convergently evolved troglomorphic traits that are shared by Astyanax cavefish, including reduction or loss of eyes and pigment and disrupted circadian cycles (Cavallari et al., 2011; Yang et al., 2016; Ceinos et al., 2018). The naked mole-rat has also evolved many of the same characteristic traits associated with life in the dark, including reduced eye size and function and a disrupted circadian clock (Riccio and Goldman, 2000). Our findings provide compelling evidence that the R263Q mutation in the core circadian clock gene cry1 has convergently evolved at least five times across cavefish and burrowing mammals (Figures 3B and 3C), indicating that a common genetic mechanism may contribute to the disruption of circadian regulation of activity and sleep in subterranean vertebrates.
Figure 3.

Convergent evolution in CRY1A across cavefish and other subterranean vertebrates
(A) Model of Astyanax mexicanus Pachón cavefish CRY1A protein based on the crystal structure of mouse CRY1 (PDB: 6kx7). The model for the A. mexicanus Pachón cavefish protein was generated with SWISS-MODEL and the comic structure was visualized with VMD (version 1.9.4). The location of R263Q (in the α10 within the FAD-binding pocket) is indicated with an arrow. This image was made with VMD/NAMD/BioCoRE/JMV/other software support. VMD/NAMD/BioCoRE/JMV/ is developed with NIH support by the Theoretical and Computational Biophysics group at the Beckman Institute, University of Illinois at Urbana-Champaign.
(B) Species tree for 23 animal species, selected to include subterranean lineages and their epigean relatives (based on the species tree available from Ensembl release 102 and (Colli et al., 2009; Patterson and Upham, 2014; Yang et al., 2016)). Branches where the R263Q mutation has evolved are highlighted in green. Illustrations depict S. anshuiensis (Chinese cavefish), P. andruzzii (Somalian cavefish), A. mexicanus (Mexican cavefish; Pachón cavefish top, Tinaja cavefish bottom), O. degus (degu), and H. glaber (naked mole-rat).
(C) Section of multiple sequence alignment for CRY1 orthologs spanning sites 187–289 in the A. mexicanus CRY1A protein. The arginine to glutamine mutation at Astyanax site 263 is indicated with a black outline.
Given that the outlier genes within regions of high divergence between Chica pools are enriched for sleep and circadian ontologies and in silico analyses indicated that some may carry deleterious mutations (Table S4), we examined sleep behavior in fish from Chica cave. Multiple laboratory-bred cavefish populations exhibit convergence on sleep loss (Duboué et al., 2011; Yoshizawa et al., 2015). Although these behavioral differences are proposed to enhance foraging opportunity in nutrient-poor cave environments (Yoshizawa et al., 2010), sleep has not been assayed in wild-caught fish and it is not known whether sleep architecture differs based on local cave environments. To test whether sleep differences are present between pool populations in Chica cave, we analyzed behavioral variation in wild-caught fish from Chica Pool one and Pool 2. We also assayed non-hybrid cavefish from Los Sabinos and Pachón for comparison. We measured sleep duration and locomotor activity under standard laboratory settings in the same wild-caught fish that were used in sequencing and genomic analyses (sample sizes are given in Table S1). As with pigmentation, sleep duration was significantly more variable in fish from Chica cave compared to Pachón and Los Sabinos caves (Bartlett′s test, p = 0.04), consistent with hybridization within Chica resulting in higher phenotypic variability. We observed that total sleep in wild-caught Pachón cavefish is significantly reduced compared to Los Sabinos cavefish (Kruskal–Wallis test, p < 0.001∗∗, KW statistic = 17.55; Dunn′s multiple comparison, p < 0.01), similar to what is observed in the laboratory stocks of fish derived from these populations (Figures 4A and 4B). Thus, the sleep loss observed in lab-reared stocks is replicated in wild-caught fish here for the first time (Yoshizawa et al., 2015; Jaggard et al., 2017). Total sleep in Chica fish from Pool one was significantly greater than sleep in fish from Pool 2 (Dunn′s multiple comparison, p < 0.05). The increase in total sleep in Chica Pool one fish was owing to an increase in the number of sleep bouts compared to fish from both Chica Pool two and Pachón cave (Figures 4B and 4C) (Dunn′s multiple comparison, Chica pool 2, p < 0.05, Pachón p < 0.05). Although sleep bout length did not differ significantly among populations (Kruskal–Wallis test, p > 0.34, KW statistic = 3.46), sleep bout length for fish from Chica Pool 2 (124.3 s) was 70% of that of fish in Chica Pool 1 (174.2 s), while sleep bout length for fish from Pachón (106.0 s) was about 60% that of fish in Chica Pool 1 (Figure 4D). These differences in sleep cannot be explained by hyperactivity of the cavefish, as the average activity during periods of wakefulness (waking activity) did not differ between any of the populations (Kruskal–Wallis test, p > 0.3, KW statistic = 3.65; Figure 4E). Therefore, hybrid Chica fish exhibit pool-specific differences in sleep, with fish from Pool two largely phenocopying Pachón cavefish and fish from Pool one exhibiting a greater sleep duration, similar to what has been previously observed in laboratory stocks of surface fish (Duboué et al., 2011; Yoshizawa et al., 2015). Although these results may be impacted by plasticity owing to the rearing environment, these results reveal the presence of behavioral differences between adjacent pools within Chica cave, with Pool two being more cavefish-like than Pool 1. This agrees with our genomic analyses, which found more cave ancestry maintained in Pool two compared to Pool one for genomic regions with a high divergence between the pools. Furthermore, the between-pool sleep differences are consistent with the ontologies and phenotypes enriched in genes in high-divergence genomic regions between pools.
Figure 4.

Sleep variation between and within wild-caught A. mexicanus cave populations
(A) Twenty-four hour sleep profiles in Chica Pool 1, Chica Pool 2, Pachón, and Los Sabinos fish.
(B) Total sleep duration is variable among different populations of wild-caught fish (Kruskal–Wallis test, p < 0.001∗∗, KW statistic = 17.55). Chica Pool two fish sleep significantly less than Chica Pool one fish (Dunn′s multiple comparison, p < 0.05∗). Wild-caught Pachón cavefish sleep significantly less than Chica Pool 1 (Dunn′s multiple comparison, p < 0.05∗).
(C) Number of sleep bouts is variable in different cave populations (Kruskal–Wallis test, p < 0.05, KW statistic = 10.62. Chica Pool two and Pachón fish have reduced sleep bout numbers compared to Chica Pool 1 (Dunn′s multiple comparison, Chica Pool 2, p < 0.05∗, Pachón, p < 0.05∗).
(D) Sleep bout duration is not significantly altered in any population of cavefish (Kruskal–Wallis test, p > 0.34, KW statistic = 3.46).
(E) Waking activity is not altered among cave populations (Kruskal–Wallis test, p > 0.3, KW statistic = 3.65). NS: Not significant.
We conclude that hybridization across different environments produced substantially different phenotypes in very close geographic proximity. Our genome-scan analyses also suggest that stronger selection against surface ancestry in specific regions of the genome in Pool two of Chica cave could be maintaining differences in genes important to local cave pool adaptation. These results are remarkable given that the pools are separated by just 10 m and provide evidence of highly localized evolution of behavior and morphology. Additionally, we found that the annotations of exceptionally divergent genes between the two cave pools associate well with the phenotypic differences observed. Notably, genes identified as highly divergent across pool microenvironments are also associated with divergent phenotypes between non-hybrid surface and cave populations. Lastly, we identified a coding variant in the core circadian clock gene cry1 that has convergently evolved in other distantly related cave-dwelling fish species and burrowing mammals. This suggests that a common genetic mechanism may contribute to disrupted circadian rhythms across multiple subterranean vertebrate lineages that have adapted to live in constant darkness. In sum, we show complex behavioral and morphological differences likely result from an interplay between hybridization and selection and establish this system as a model to study the genetic basis of evolution in complex behavioral and morphological traits.
Limitations of the study
One limitation of the present study is the small sample size for Chica Pool 1, which limits the power of our morphological and genomic analyses. Obtaining fish from the cave environment remains a central challenge to the community, and future cave expeditions should provide increased statistical power and a broader sampling of pools within the caves. Additionally, when population sizes are small and have undergone bottleneck events, as appears to be the case for most cave populations of A. mexicanus (Herman et al., 2018), genomic signatures left by genetic drift can mimic selection. However, our analyses for selection control for this to some extent by incorporating demographic parameters, including past population size expansions and contractions in cave and surface populations. Future work investigating hybrid fitness among pools within Chica cave may provide a clearer picture of whether hybridization promotes adaptive evolution in this system and which factors contribute to the maintenance of this hybrid zone.
STAR★Methods
Key resources table
Resource availability
Lead contact
Further information and requests for resources and reagents should be directed to and will be fulfilled by the lead contact, Alex Keene (akeene@bio.tamu.edu).
Materials availability
This study did not generate new reagents.
Experimental model and subject details
Adult Astyanax mexicanus were collected with nets during the dry season in 2015. The fish were transported and housed in the aquatic facility at Universidad Autónoma de Querétaro in 24 h constant darkness. We took gerenal body measurements on each fish, including weight, mass, length, and height (Figure S4). Fish were fed 1-2 times daily with dry flakes and kept at 23°C. These conditions were maintained throughout housing and experimental conditions for consistency. All fish were inspected for overall health, and any exhibiting signs of health or stress issues were excluded from experimental tests. Fish collected were used for morphological and sleep behavior analyses and for genomic sequencing analyses.
We did not test for an effect fo sex in the analyses. Sex is often not reported as a covariate in Astyanax literature (see Protas et al., 2006, 2008; Yoshizawa et al., 2010, 2015; Moran et al., 2014; Carlson and Gross, 2018; Frøland Steindal et al., 2018). Where sex has been tested as a factor in the Astyanax literature, there is often little difference between males and females in phenotypes or behavior. For example, there was a trend toward a tendency to school based on sex, but there was no information given on which direction (i.e., more schooling in males or females) (Kowalko et al., 2013), but sex was not significant for feeding angle (Kowalko et al., 2013). There were no sex-specific effects on basal sleep or in any of the treatment groups in Jaggard et al. (2017). Nor were there sex differences in aggressive behavior in Elipot et al. (2013) or stress behaviors in Chin et al. (2018). Females are larger than males (Protas et al., 2008), but none of the other traits examined in Protas et al. (2008) were noted to be impacted by sex (eye size, melanophore number, relative condition, weight loss, tooth count, peduncle depth, fin placement, anal fin rays, SO3 width, number of thoracic ribs, and chemical sense).
Method details
Study system
Evidence suggests that there have been at least two colonization events of northern Mexico by surface dwelling A. mexicanus, typically referred to as the “old” and “new” lineage. One lineage of surface fish colonized the caves in the El Abra region and a separate lineage of surface fish subsequently colonized the northern Guatemala region and western Micos region caves of Northeastern Mexico. While we now know that these two lineages and their invasion of the caves were not timed in line with the “old” and “new” designations (Herman et al., 2018), we use this shorthand here since these labels are consistent with past work (Dowling et al., 2002; Ornelas-García et al., 2008; Bradic et al., 2012; Coghill et al., 2014). The surface fish within the Rascón/Gallinas river system are most similar to the old lineage cavefish and were likely isolated from colonization by the new lineage surface fish due to a 105 m vertical waterfall (Herman et al., 2018). Cavefish within the El Abra region that descended from old lineage of surface ancestors are now within close geographic proximity to surface fish from the new lineage.
Within Chica cave, fish occupy multiple pools that naturally differ in ecology. Whether the Chica cave population came from the old or new lineage stock has been the subject of much debate in the cavefish community. Fish from Chica cave show higher genetic differentiation from the rest of the El Abra cave populations, which has been interpreted as evidence of an independent, very recent invasion event (Bradic et al., 2012). However, this pattern could also be explained if Chica cavefish were evolved from an old lineage ancestor but experienced extensive hybridization with local, new-lineage surface populations (Avise and Selander, 1972). In accordance with this hypothesis, recent phylogenetic analyses revealed that fish from Chica cave possess new lineage mitochondrial DNA and old lineage nuclear DNA, indicative of historical introgression (Ornelas-García et al., 2008; Strecker et al., 2012).
Identifying the genetic underpinnings of behavioral evolution can be especially challenging in natural populations (Fitzpatrick et al., 2005; Niepoth and Bendesky, 2020). A genomic signature of local adaptation is most detectable when gene flow is high among populations in different environments (Hoban et al., 2016; Tigano and Friesen, 2016), as gene flow homogenizes the background level of divergence between populations while selection maintains differentiation at regions important to local adaptation. High levels of gene flow between the Chica cave and surface population and strong selection for adaptation to the cave environment are predicted to shape patterns of divergence across the genome and provide insight into the genes important for maintaining cave phenotypes. Therefore, this system provides the unique opportunity to investigate the genetic basis of adaptive traits.
Sequencing and genotyping
We used whole genome resequencing and population genomic analyses to (1) characterize population structure and genetic relationships between and within the Chica cavefish, three other cavefish populations, and two surface populations; (2) identify candidate regions for local adaptation with high levels of genetic differentiation between Chica pools; and (3) test for signatures of introgression between Chica cave and other nearby cave and surface populations. Sequencing used in these analyses originated from wild-caught fish collected from two adjacent pools within Chica cave (Pool 1, approximately 91 m from the entry, and Pool 2, approximately another 10 m into the cave; Figure 1A).
Fin clips were collected from adult fish from Chica cave in 2015 and stored in 80% ethanol. We sequenced a total of 19 A. mexicanus samples from Chica cave (five from Pool 1 and 14 from Pool 2) using 125 bp paired end reads on an Illumina HiSeq 2500 at the University of Minnesota Genomics Center. Fin clips were collected from adult fish from Los Sabinos cave (n = 3) in 2015 and were sequenced using 150 bp paired end reads on an Illumina NovaSeq S4. Genomic libraries for all Chica samples and two of the Los Sabinos samples (Sabinos_T3076_S26 and Sabinos_T3093_S27) were prepared using Illumina TruSeq v3 Nano DNA Sample Prep Kits. The genomic library for the third Los Sabinos sample (Sabinos1) was prepared using a Chromium Genome Library Kit and Gel Bead Kit v2 and a Chromium Genome Chip Kit v2. Pachón, Tinaja, Río Choy, Rascón, and A. aeneus samples were all previously sequenced as 100 bp paired end reads on an Illumina HiSeq2000 at The University of Minnesota Genomics Center (Herman et al., 2018). Raw sequencing data for these samples was downloaded from NCBI (SRA Accession Numbers SRP046999, SRR4044502, and SRR4044501). Sequencing resulted in a mean ± SE of 187,777,319 ± 3,047,876 reads per individual for the 19 Chica samples and 331,445,356 ± 248,640,606 reads per individual for the three Los Sabinos samples. After quality filtering and mapping, all 60 samples had a mean ± SE genome-wide depth of coverage of 10.50 ± 0.53X (details on read counts, sequencing quality, and coverage are available are in the following Dryad Data Repository: https://doi.org/10.5061/dryad.2rbnzs7nw).
To investigate recent patterns of introgression between Chica cave and surface fish, we also obtained A. mexicanus sequence data from fish from one other cave population in the El Abra region that is not heavily admixed (Tinaja, n = 10), a nearby new lineage surface population (Río Choy, n = 9), and an old lineage surface population (Rascón, n = 8) (Herman et al., 2018). It has been hypothesized that caves within the southern El Abra region exchange migrants through subterranean connections, and Tinaja was previously shown to contain fish with mostly cave-like phenotypes (Mitchell et al., 1977). Thus, Tinaja cavefish sequence can provide a reference to identify cave alleles in the putative hybrid swarm present in Chica cave.
Río Choy contains new lineage surface fish and is a tributary of the Tampaón River, which is believed to be the source of surface fish in Chica cave. Rascón is a tributary of the Gallinas River, and contains old lineage surface fish (Herman et al., 2018). Thus, including genomic data from Tinaja, Río Choy, and Rascón in our analyses provides a means to test for recent introgression between new lineage surface fish and old lineage cavefish within Chica cave. Previously published data from a closely related congener, Astyanax aeneus (n = 1) (Herman et al., 2018), was also included to serve as an outgroup in tests for introgression.
We conducted genotype calling following the GATK Best Practices (McKenna et al., 2010; Depristo et al., 2011; Van der Auwera et al., 2013). Adapters were trimmed from raw reads using Cutadapt v1.2.1 (Martin, 2011). We trimmed samples for quality using Trimmomatic v0.30 (Bolger et al., 2014) and specified a minimum quality score of 30 across a 6 bp sliding window and discarded reads with a length of <40 nucleotides. Reads were aligned to the surface Astyanax mexicanus genome (Astyanax_mexicanus-2.0, downloaded from NCBI) using bwa v0.7.4 (Li and Durbin, 2009). We used Picard v2.3.0 (http://broadinstitute.github.io/picard/) to remove duplicates and add read group information and used samtools v1.7 (Li et al., 2009) to split de-duplicated bams into mapped and unmapped reads. Mapped bams were used to generate per-individual gvcfs with the Genome Analysis Tool Kit (GATK) v3.7.0 HaplotypeCaller tool. We used the GenotypeGVCFs tool in GATK v3.8.0 to produce vcf files for each chromosome and unplaced scaffolds that include all individuals (and include invariant sites). The SelectVariants and VariantFiltration tools in GATK v3.8.0 were used to apply hard filters. We subset vcfs for each chromosome and unplaced scaffold into invariant, SNPs, and mixed/indel sites and applied filters separately following GATK best practices (Table S1). We then used the MergeVcfs tool in GATK v4.1.4 to re-combine all subset VCFs for each chromosome and unplaced scaffold. Indels and the 3 bp region around each indel were removed using a custom python script. We used the vcftools (Danecek et al., 2011) --exclude-bed option to remove repetitive regions identified by WindowMasker and RepeatMasker (McGaugh et al., 2014). We also used vcftools to only retain biallelic SNPs, to remove sites with greater than 20% missing data within each population, and to remove variants with a minor allele frequency <1%. This resulted in retaining a total of 225,462,242 sites throughout the 1.29 Gb genome, 3,337,738 of which were SNPs.
Population structure
To quantify the number of distinct genetic clusters (i.e., populations) present among the A. mexicanus cave and surface populations, we used ADMIXTURE v1.3.0 (Alexander et al., 2009) and Principal Components Analysis (PCA). For these analyses, we applied a more stringent missing data filter, only retaining sites with <10% missing data. To control for linkage between SNPs that cluster locally on a given chromosome, we thinned SNPs to 1 kb apart and did not include unplaced scaffolds. This resulted in a set of 678,637 SNPs. We ran ADMIXTURE for each value of K from two through nine and estimated the best value of K using the Cross Validation (CV) procedure in ADMIXTURE. The best K was chosen as the value that had the lowest CV error. We used Plink v1.90 (Purcell et al., 2007) to conduct the PCA. For this analysis, we again thinned SNPs to 1 kb apart, but included all placed and unplaced scaffolds. This resulted in a set of 733,979 SNPs.
Genome-wide tests for introgression
Fish within Chica cave have been hypothesized to be a hybrid swarm between cavefish originating from other caves in the El Abra region (which enter into Chica cave via a subterraneous connection) and surface fish from the nearby Río Choy/Tampaón river system (Mitchell et al., 1977). To formally test this hypothesis, we conducted genome-wide tests for introgression between Chica cavefish and Tinaja cavefish and between Chica cavefish and Río Choy surface fish. We first used Treemix v1.13 (Pickrell and Pritchard, 2012) to confirm relationships between our focal populations and to visualize migration events between populations. Treemix builds a bifurcating tree to represent population splits and also incorporates migration events, which are represented as “edges” connecting population branches. We first built the maximum likelihood tree (zero migration events) in Treemix and then ran Treemix sequentially with one through five migration events. For this analysis, we included individuals from Chica, Río Choy (new lineage surface), Rascón (old lineage surface), and Tinaja (old lineage cave) A. mexicanus populations and the A. aeneus individual (outgroup), and SNPs were thinned to 1 kb apart. We supplied this set of 700,502 biallelic SNPs to Treemix, rooted with A. aeneus, and estimated the covariance matrix between populations using blocks of 500 SNPs. Samples Tinaja_E, Tinaja_6, and Rascon_6 were excluded from this analysis because ADMIXTURE indicated that they were likely early generation hybrids. We calculated the variance explained by each model (zero through five migration events) using the R script treemixVarianceExplained.R (Card, 2015).
To test our hypothesis that Chica represents a hybrid population resulting from admixture between the nearby old lineage cave and new lineage surface populations, we used Dsuite v0.4 (Malinsky, 2019) to conduct formal tests for introgression between (1) Chica cavefish and Tinaja cavefish, and (2) between Chica cavefish and Río Choy surface fish. If no gene flow is occurring between the fish in Chica cave and the local surface population, we predict that fish from Chica (which has previously been shown to group phylogenetically with old lineage cavefish populations (Avise and Selander, 1972; Espinasa and Borowsky, 2001; Dowling et al., 2002; Strecker et al., 2003; Hausdorf et al., 2011; Strecker et al., 2012)) should share more derived alleles with fish from Rascón (a surface population that is more geographically distant from Chica but also old lineage) than fish from Río Choy (a surface population that is geographically close to Chica cave but is new lineage). For this analysis, we supplied the set of 700,502 biallelic SNPs to Dsuite and specified A. aeneus as the outgroup. We again excluded three samples from Tinaja and Rascón with apparent hybrid ancestry. We used the Dsuite program Dtrios to calculate Patterson’s D statistic for all possible trios of populations using the ABBA-BABA test (Green et al., 2010). The ABBA-BABA test quantifies whether allele frequencies follow those expected between three lineages (e.g., sister species P1 and P2, and a third closely related species, P3) under expectations for incomplete lineage sorting (ILS). Observing a greater proportion of shared derived alleles between P1 and P3 but not P2 or between P2 and P3 but not P1 than what would be expected by chance (i.e., ILS) indicates introgression. Dsuite requires a fourth population, P4, to serve as an outgroup and determine which alleles are ancestral versus derived. Ancestral alleles are labeled as “A” and derived alleles are labeled as “B”. ABBA sites are those where P2 and P3 share a derived allele, and ABAB sites are those where P2 and P4 share a derived allele. The D statistic is calculated as the difference in the number of ABBA and BABA sites relative to the total number of sites examined. Dsuite uses jackknifing of the null hypothesis that no introgression has occurred (D statistic = 0) to calculate a p-value for each possible trio of populations.
Dsuite also calculates the admixture fraction, or f4-ratio, which represents the covariance of allele frequency differences between P1 and P2 and between P3 and P4. If no introgression has occurred since P1 and P2 split from P3 and P4, then f4 = 0. The f4 statistic is positive, this suggests a discordant tree topology indicative of introgression.
Local ancestry inference
Hybrid genomes exhibit a mosaic of ancestry from their parental populations. A number of recent studies have shown that hybridization interacts with recombination and selection to shape patterns of local ancestry along chromosomes (Hohenlohe et al., 2012; Wang et al., 2016; Janzen et al., 2018; Schumer et al., 2018; Leitwein et al., 2019). Non-random distributions of local ancestry in hybrid populations can indicate selection. Our goal here was to visualize patterns of introgression across the genome in Chica cavefish and determine whether more surface ancestry is present in Chica Pool 1 compared to Chica Pool 2. We used Hidden Markov Model (HMM) and fine-scale SNP mapping approaches to calculate ancestry proportions globally (i.e. genome-wide) and locally (at each base pair along each of the 25 chromosomes) in both Chica pools. To determine whether Pool 1 (nearer to the cave entrance) carries a higher proportion of surface ancestry compared to Pool 2 (deeper in the cave) at regions of the genome important to cave adaptation, we also asked whether regions of high divergence between pools exhibit higher differences in local ancestry.
We implemented a HMM-based approach in Loter (Dias-Alves et al., 2018) to infer genome-wide local ancestry in the Chica individuals. Tinaja and Río Choy served as the parental cave and surface populations, respectively, for the initial training stage of the HMM. We excluded two Tinaja samples that showed putative evidence of admixture (Herman et al., 2018). This analysis allowed us to estimate global ancestry proportions and mean minor and major parent tract lengths for each individual. Ancestry tract lengths were converted from base pairs to Morgans using the median genome-wide recombination rate of median recombination rate of 1.16 cM/Mb obtained from a previously published genetic map for A. mexicanus (O’Quin et al., 2013). We then estimated the number of generations since the onset of admixture (Tadmix) in each pool using the following equation:
where LM is the mean ancestry tract length from the minor parent in Morgans and pB is the proportion of the genome derived from the major parent (the probability of recombining) (Jin et al., 2014; Gravel, 2012; Schumer et al., 2016).
We next used a chromosome painting approach with ancestry-informative sites to validate the delimitation of ancestry blocks detected by the HMM and to visualize patterns of introgression across the Chica cavefish genomes. This approach provides a lower level of resolution for ancestry block delimitation but with higher power to classify regions as derived from either parental genome. We identified alleles that were differentially fixed in Río Choy and Tinaja parental populations and had no missing data using the script get_fixed_site_gts.rb (https://github.com/mmatschiner/tutorials/blob/master/analysis_of_introgression_with_snp_data/src/get_fixed_site_gts.rb). We thinned SNPs to be a minimum of 1 kb apart and mapped these ancestry-informative sites in the Chica samples using the script plot_fixed_site_gts.rb (https://github.com/mmatschiner/tutorials/blob/master/analysis_of_introgression_with_snp_data/src/plot_fixed_site_gts.rb).
Synthesizing patterns of genetic divergence and local ancestry
To quantify and visualize patterns of divergence between Pool 1 and Pool 2, we calculated summary statistics (Dxy, Fst, Pi) in non-overlapping 50 kb windows across the genome using the python script popgenWindows.py (https://github.com/simonhmartin/genomics_general/blob/master/popgenWindows.py). Fst can be influenced by heterogeneous genetic diversity between populations, and a recent study (Herman et al., 2018) demonstrated that low Pi in caves can inflate relative divergence estimates in A. mexicanus. We therefore chose to use Dxy, which is not affected by levels of nucleotide diversity within populations, to identify regions of high genetic divergence between Chica pools.
We asked whether there was an association between differences in local ancestry between pools and absolute genetic divergence (Dxy) between pools within outlier windows (which included coding and non-coding regions). We identified outlier windows as any 50 kb window with a Dxy value above the 95th percentile (Dxy >0.0034). Within each outlier window, we calculated the difference in local ancestry between fish from Pool 1 and Pool 2 at each site. We used a Wilcoxon rank sum test to identify whether ancestry differed within these regions between fish from Pool 1 versus Pool 2. We used Pearson’s correlation implemented in R v4.0.2 to test for an association between difference in local ancestry and sequence divergence (Dxy) at each site between Chica Pool 1 and Pool 2 within outlier windows.
We also calculated Dxy and Fst on a site-by-site basis using custom python scripts (Cave_fish_Dxy.py and Cave_fish_Fst.py). This allowed us to calculate the maximum, minimum. mean, and standard deviation for Dxy and Fst for the coding region (CDS) for each gene in the A. mexicanus genome annotation (v101, downloaded from ftp://ftp.ensembl.org/pub/release-101/gtf/astyanax_mexicanus/) using a custom python script (Dxy_Summary_per_gene_ensemblGTF.py and Fst_Summary_per_gene_ensemblGTF.py). We ranked genes by relative level of differentiation between Pool 1 and Pool 2. From this ranked list, we considered all genes with a mean Dxy above the 95th percentile (Dxy >0.0034; 2,170 out of 25,809 genes; Table S4) as putative candidates for cave adaptation.
We used the GO Consortium Gene Ontology Enrichment Analysis tool (http://geneontology.org/) to ask whether any categories of biological processes were overrepresented in our set of outlier genes. We used the human (Homo sapiens) reference database for this analysis (20,851 genes). Fisher’s exact tests were performed to determine whether the number of genes associated with a given ontology were over- or under-represented in our set of outlier genes relative to the reference database. We also used Ensembl’s BioMart (v104, https://www.ensembl.org/biomart/martview) to identify any zebrafish, mouse, and human phenotypes associated with each gene in the A. mexicanus surface fish reference genome annotation. We asked whether genes with the highest divergence between Chica pools (Dxy in the top 5%) were enriched for suites of phenotypes typically associated with local adaptation in cavefish (i.e., eye function and morphology, pigmentation, sleep behavior and circadian rhythm, sensory processing by neuromasts, and feeding behavior and body mass, and metabolism) (Keene et al., 2015; McGaugh et al., 2020) using Fisher’s exact tests.
We identified coding variants present among both Chica pools, Tinaja, and Río Choy and predicted the consequence of each variant on protein function using in silico computational analysis with the SIFT (sorting intolerant from tolerant) algorithm (Kumar et al., 2009) and the Ensembl Variant Effect Predictor (VEP) software suite (McLaren et al., 2016). SIFT uses sequence homology and data on the physical properties of a given protein to predict whether an amino acid substitution will be tolerated or deleterious. VEP performs annotation and analysis of genomic variants to predict impact on the protein sequence (i.e., modifier, low, moderate, or high).
Preliminary analyses indicated that one of our top candidate genes with high sequence divergence between Chica pools (cry1a) harbored a putative deleterious coding mutation (R263Q). To determine whether this variant is derived in cavefish and assess whether it occurs at evolutionarily conserved sites, we used the Astyanax surface fish genome annotation to obtain the CDS for cry1a from our population genomic data. We searched Ensembl for gene orthologs available in other animal species, including human, mouse, zebrafish, staghorn coral (Acropora millepora), thale cress (Arabidopsis thaliana), and three cyprinid cavefish species from China, the blind barbel (Sinocyclocheilus anshuiensis), the golden-line barbel (Sinocyclocheilus grahami), and the horned golden-line barbel (Sinocyclocheilus rhinocerous). We also downloaded the CDS for cry1a from another cyprinid cavefish species from Somalia, Phreatichthys andruzzii, from NCBI. We conducted a multiple species alignment for all 285 cry1 orthologs using Muscle (Edgar, 2004). While investigating the R263Q mutation in cry1a, we identified a misassembly in the Astyanax mexicanus surface genome (Astyanax_mexicanus-2.0, downloaded from NCBI) affecting exons 9-13 of the cry1a coding region (cry1a CDS: 14,394-15,659 bp). Further investigation revealed that a portion of the coding region (cry1a CDS: 268-597 bp) was missing from the Pachón cavefish genome assembly (Astyanax_mexicanus-1.0.2, downloaded from NCBI). To confirm the mutation we identified in our population genomic data, we downloaded previously published cry1a mRNA sequences with complete CDS from Chica cave, Pachon cave, and Micos River (NCBI accession #s KF737846- KF737848) (Beale et al., 2013). Aligning our population genomic data to the mRNA allowed us to verify that the correct exon coordinates were used around the mutation of interest. To visualize the location of the R263Q mutation, we created a 3D model of the Astyanax Pachón cavefish CRY1A protein in SWISS-MODEL (Waterhouse et al., 2018) using mouse CRY1 crystal structure (PDB: 6kx7). We imported the model into VMD (version 1.9.4) for visualization. To visualize the phylogenetic relationship between lineages with the R263Q mutation an identify putative instances of convergent evolution, we constructed a species tree that included 23 animal species (subterranean lineages and their close relatives) based on the species tree available from Ensembl release 102 and (Colli et al., 2009; Patterson and Upham, 2014; Yang et al., 2016).
To test for signatures of selection in regions of the genome containing outlier genes, we used diploS/HIC (Kern and Schrider, 2018) to detect and classify selective sweeps. diploS/HIC uses a powerful supervised machine learning approach to identify windows in the genome that have undergone “soft” sweeps (selection on standing genetic variation) or “hard” sweeps (selection on new mutations) with high accuracy. We first simulated selective sweeps with discoal (Kern and Schrider, 2016) using demographic parameters for cavefish and surface fish populations obtained from a previous study (Herman et al., 2018). We then used the simulated data to train diploS/HIC to identify selective sweeps in our empirical data. We provided diploS/HIC with a VCF containing the 3,337,738 SNPs showing <20% missing data across all populations and a masked version of the surface fish genome. We generated feature vectors (matrices with multiple metrics of selection across each genomic window (Kern and Schrider, 2018)) for both Chica pools using 11 sub-windows across a 55,000 Mb region (i.e., data was generated in 5,000 kb windows across the genome). diploS/HIC ran predictions using the feature vectors to classify each window as neutral (no evidence of a selective sweep), linkedSoft (loci near a window that has undergone a soft sweep), linkedHard (loci near a window that has undergone a hard sweep), soft (loci that have undergone a soft sweep), or hard (loci that have undergone a hard sweep). We then summarized diploS/HIC calls for each gene (Table S4). We classified genes as neutral if they had no calls indicating linked selection or sweeps. Genes were classified as putatively under selection if they contained any calls of linked, soft, or hard sweeps.
Sleep behavior phenotyping
We phenotyped wild-caught fish from Pools 1 and 2 within Chica cave and from two other cave populations, Pachón and Los Sabinos, which served as controls. After the completion of behavioral assays, fin clips were collected from all Chica individuals for use in genomic sequencing as described above. Fish were maintained in the laboratory for eight months prior to behavioral assays. Fish were recorded in standard conditions in 10 L tanks with custom-designed partitions that allowed for five fish (2 L/fish) to be individually housed in each tank as previously described (Yoshizawa et al., 2015). Recording chambers were illuminated with custom-designed IR LED source (Infrared 850 nm 5050 LED Strip Light, Environmental Lights). After a 4–5 day acclimation period, behavior was recorded for 24 h beginning ZT0-ZT2. Videos were recorded at 15 frames/sec using a USB webcam (LifeCam Studio 1080 p HD Webcam, Microsoft) fitted with a zoom lens (Zoom 7000, Navitar). An IR high-pass filter (Edmund Optics Worldwide) was placed between the camera and the lens to block visible light. Videos were recorded using Virtualdub, a video-capturing software (v1.10.4) and were subsequently processed using Ethovision XT 9.0 (Noldus, IT). Water temperature and chemistry were monitored throughout recordings, and maintained at standard conditions in all cases. Ethovision tracking was set up as previously described (Yoshizawa et al., 2015). Data was processed using Perl scripts (v5.22.0, developed on-site) and Excel macro (Microsoft) (Yoshizawa et al., 2015). These data were used to calculate sleep information by finding bouts of immobility of 60 s and greater, which are highly correlated with increased arousal threshold, one of the hallmarks of sleep (Yoshizawa et al., 2015).
Morphological characterization
Melanophores were quantified from bright-field images captured from each side of the body. Areas were chosen based on previous literature (Stahl et al., 2018) (i.e., caudal fin area, adipose fin area, dorsal area, eye cup area, anal fin area, infra-orbital area; see Figure S1). Briefly, images were loaded into Fiji ImageJ (v. 1.7, National Insitutes of Health, Bethesda, MD). Images were color inverted in the selected area and using a preset noise tolerance allowed for melanophores to be automatically quantified by using pixel light intensity. If any melanophores were not counted, they were then manually added. Each image was analyzed by two different researchers to assure no significant discrepancies in quantifying, and the population of origin was blind to the researchers. All final quantifications were corrected to body length to account for different sized fish.
Eye presence and size were determined from images acquired on a handheld digital microscope (Dinoscope Pro AM4111T). Images were analyzed in Fiji ImageJ. Each image was inspected for the presence of an eye by two investigators, and the population of origin was blind to the researchers. Eye size was calculated in ImageJ by creating an ROI for the eye diameter and dividing this number by the length of the body to correct for overall size differences.
Quantification and statistical analysis
All statistical tests for morphology and behavior were performed in GraphPad Prism v9.0. For data comparing two independent groups, a two-tailed unpaired t-test was performed, where significance was determined using a p-value statistic. All multivariate data was tested for normality with a Shapiro-Wilk test. Data that did not pass normality tests were analyzed using nonparametric Kruskal-Wallis test, where significance was determined by a p-value statistic. Where statistical significance was indicated, post-hoc comparisions were carried out using Dunn’s multiple comparison test. Due to the small sample size of collected fish, all behavioral and morphological data failed normality testing, resulting in the use of nonparametric tests for all multivariate data. To test for variance among morphological features, Brown-Forsythe equality of variance and Bartlett’s tests of variance were performed. Statistical significance of standard deviations were determined with a p-value statistic.
Statistical tests for all genomic analyses were performed in R v4.0.2. Prior to each analysis, Shapiro-Wilk tests were used to assess normality in the data. Data deviating from normality were analyzed using nonparamtric tests. Comparisons between cave and surface ancestry in fish in Chica Pool 1 (n = 5) and Chica Pool 2 (n = 14) were conducted using a Wilcoxon rank sum test. The relationship between local ancestry and genetic distance between pools was analysed with Pearson’s correlation. Gene ontology and phenotype enrichment analyses within the Chica cave outlier gene set used Fisher’s exact tests.
Acknowledgments
We thank two anonymous reviewers for their comments and feedback which have greatly improved this manuscript. We thank the University of Minnesota Genomics Center for their guidance and for performing the library preparations and sequencing. The Minnesota Supercomputing Institute (MSI) at the University of Minnesota provided resources that contributed to the research results reported within this article. Funding was supported by NIH 1R01GM127872-01 to SEM, ACK, and NR, NSF award IOS-165674 to ACK, a US-Israel BSF award to ACK, NSF award DEB-2147597 to JK and ACK, NSF awards IOS-1933076 and IOS-2202359 to JK, SEM, and NR, and NIH NHLBI sleep training grant T32HL007713-28 to JBJ. Fish were collected under CONAPESCA permit SGPA/DGVS/266/15 to Claudia Patricia Ornelas García.
Author contributions
Conceptualization, S.E.M. and A.C.K.; investigation and analysis, R.L.M., J.B.J., E.Y.R., A.K., N.R., J.E.K., P.O.-G., S.E.M., and A.C.K.; visualization, R.L.M., J.B.J., E.Y.R.; writing - original draft, R.L.M., writing - review and editing, R.L.M., J.B.J., E.Y.R., A.K., N.R., J.E.K., P.O.-G., S.E.M., and A.C.K.
Declaration of interests
The authors declare no competing interests.
Published: February 18, 2022
Footnotes
Supplemental information can be found online at https://doi.org/10.1016/j.isci.2022.103778.
Supplemental information
The sheet SummaryStatsAllGenes includes from left to right, GeneID, Scaffold, Start, End, Gene Symbol, Gene Description, associated phenotypes from Ensembl BioMart v104 (in zebrafish, mouse, and human), whether the phenotype descriptions contain keywords associated with phenotypes known to be involved in cave adaptation (e.g., eye/lens/retina), absolute genetic divergence (Dxy) and associated summary statistics for each gene in comparisons between Chica Pool 1 and Pool 2, Rascón and Tinaja, and Rascón and Pachón, summaries of the number of detected deleterious variants in SIFT and VEP in silico analyses, and results diploS/HIC selection analyses (conducted in 5 kb windows throughout the genome) for each gene. We also present the percent rank (i.e., the relative ranking of each value within the dataset) for each gene for mean Dxy between Pachón and Rascon, mean Dxy between Tinaja and Rascon, and maximum Fst between Chica Pool 1 and Chica Pool 2. Rows containing genes in the top 5% of Dxy values between Chica Pool 1 and Chica Pool 2 are highlighted in light green. The sheets GeneOntologyEnrichment and PhenotypeEnrichment show the results of the GO enrichment analysis and phenotype enrichment analyses, respectively, on genes with highest genetic divergence (top 5% Dxy) between Chica Pool 1 and Chica Pool 2. For the GO enrichment results, genes with phenotypes known to be adaptive in cave environments and highlighted. (See excel file.)
Data and code availability
Data - Sequence data generated in this study have been depostited in the NCBI Sequence Read Archive and are publically available as of the date of publication. Accession numbers are listed in the key resources table. Original data underlying genotyping of the cry1a mutation from Astyanax cDNA can be accessed from the Stowers Original Data Repository (URL available in key resources table).
Code - All original code has been deposited to GitHub and has been made publically available as of the date of publication (URL available in key resource table).
Other - Any additional information required to reanalyze the data reported in this paper is available from the lead contact upon request.
References
- Alexander D.H., Novembre J., Lange K. Fast model-based estimation of ancestry in unrelated individuals. Genome Res. 2009;19:1655–1664. doi: 10.1101/gr.094052.109. [DOI] [PMC free article] [PubMed] [Google Scholar]
- Aspiras A.C., Rohner N., Martineau B., Borowsky R.L., Tabin C.J. Melanocortin 4 receptor mutations contribute to the adaptation of cavefish to nutrient-poor conditions. Proc. Natl. Acad. Sci. U.S.A. 2015;112:9668–9673. doi: 10.1073/pnas.1510802112. [DOI] [PMC free article] [PubMed] [Google Scholar]
- Van der Auwera G.A., Carneiro M.O., Hartl C., Poplin R., Del Angel G., Levy-Moonshine A., Jordan T., Shakir K., Roazen D., Thibault J., et al. From FastQ data to high confidence variant calls: the Genome Analysis Toolkit best practices pipeline. Curr. Protoc. Bioinformatics. 2013;43:11.10.1–11.10.33. doi: 10.1002/0471250953.bi1110s43. [DOI] [PMC free article] [PubMed] [Google Scholar]
- Avise J.C., Selander R.K. Evolutionary genetics of cave-dwelling fishes of the genus astyanax. Evolution. 1972;26:1–19. doi: 10.1111/j.1558-5646.1972.tb00170.x. [DOI] [PubMed] [Google Scholar]
- Beale A., Guibal C., Tamai T.K., Klotz L., Cowen S., Peyric E., Reynoso V.H., Yamamoto Y., Whitmore D. Circadian rhythms in Mexican blind cavefish Astyanax mexicanus in the lab and in the field. Nat. Commun. 2013;4:2769. doi: 10.1038/ncomms3769. [DOI] [PubMed] [Google Scholar]
- Bibliowicz J., Alié A., Espinasa L., Yoshizawa M., Blin M., Hinaux H., Legendre L., Père S., Rétaux S. Differences in chemosensory response between eyed and eyeless Astyanax mexicanus of the Rio Subterráneo cave. EvoDevo. 2013;4:25. doi: 10.1186/2041-9139-4-25. [DOI] [PMC free article] [PubMed] [Google Scholar]
- Bolger A.M., Lohse M., Usadel B. Trimmomatic: a flexible trimmer for illumina sequence data. Bioinformatics. 2014;30:2114–2120. doi: 10.1093/bioinformatics/btu170. [DOI] [PMC free article] [PubMed] [Google Scholar]
- Bradic M., Beerli P., García-de León F.J., Esquivel-Bobadilla S., Borowsky R.L. Gene flow and population structure in the Mexican blind cavefish complex (Astyanax mexicanus) BMC Evol. Biol. 2012;12:9. doi: 10.1186/1471-2148-12-9. [DOI] [PMC free article] [PubMed] [Google Scholar]
- Breder C.M. Descriptive ecology of La Cueva Chica, with especial reference to the blind fish, Anoptichthys. Zoologica. 1942;27:7–16. [Google Scholar]
- Bresadola L., Caseys C., Castiglione S., Buerkle C.A., Wegmann D., Lexer C. Admixture mapping in interspecific Populus hybrids identifies classes of genomic architectures for phytochemical, morphological and growth traits. New Phytol. 2019;223:2076–2089. doi: 10.1111/nph.15930. [DOI] [PMC free article] [PubMed] [Google Scholar]
- Bridges W. The blind fish of La Cueva Chica. Bull. N. Y. Zool. Soc. 1940;43:74–97. [Google Scholar]
- Calfee E., Agra M.N., Palacio M.A., Ramírez S.R., Coop G. Selection and hybridization shaped the rapid spread of African honey bee ancestry in the Americas. PLoS Genet. 2020;16:e1009038. doi: 10.1371/journal.pgen.1009038. [DOI] [PMC free article] [PubMed] [Google Scholar]
- Card D. GitHub Repository; 2015. RADpipe. [DOI] [Google Scholar]
- Carlson B.M., Gross J.B. Characterization and comparison of activity profiles exhibited by the cave and surface morphotypes of the blind Mexican tetra, Astyanax mexicanus. Comp. Biochem. Physiol. C Toxicol. Pharmacol. 2018;208:114–129. doi: 10.1016/j.cbpc.2017.08.002. [DOI] [PMC free article] [PubMed] [Google Scholar]
- Cashmore A.R., Jarillo J.A., Wu Y.J., Liu D. Cryptochromes: blue light receptors for plants and animals. Science. 1999;284:760–765. doi: 10.1126/science.284.5415.760. [DOI] [PubMed] [Google Scholar]
- Cavallari N., Frigato E., Vallone D., Fröhlich N., Lopez-Olmeda J.F., Foa A., Berti R., Sánchez-Vázquez F.J., Bertolucci C., Foulkes N.S. A blind circadian clock in cavefish reveals that opsins mediate peripheral clock photoreception. PLoS Biol. 2011;9:e1001142. doi: 10.1371/journal.pbio.1001142. [DOI] [PMC free article] [PubMed] [Google Scholar]
- Ceinos R.M., Frigato E., Pagano C., Fröhlich N., Negrini P., Cavallari N., Vallone D., Fuselli S., Bertolucci C., Foulkes N.S. Mutations in blind cavefish target the light-regulated circadian clock gene, period 2. Sci. Rep. 2018;8:8754. doi: 10.1038/s41598-018-27080-2. [DOI] [PMC free article] [PubMed] [Google Scholar]
- Chin J.S.R., Gassant C.E., Amaral P.M., Lloyd E., Stahl B.A., Jaggard J.B., Keene A.C., Duboue E.R. Convergence on reduced stress behavior in the Mexican blind cavefish. Dev. Biol. 2018;441:319–327. doi: 10.1016/j.ydbio.2018.05.009. [DOI] [PMC free article] [PubMed] [Google Scholar]
- Coghill L.M., Hulsey C.D., Chaves-Campos J., de Leon F.J.G., Johnson S.G. Next generation phylogeography of cave and surface Astyanax mexicanus. Mol. Phylogenet. Evol. 2014;79:368–374. doi: 10.1016/J.YMPEV.2014.06.029. [DOI] [PubMed] [Google Scholar]
- Colli L., Paglianti A., Berti R., Gandolfi G., Tagliavini J. Molecular phylogeny of the blind cavefish Phreatichthys andruzzii and Garra barreimiae within the family Cyprinidae. Environ. Biol. Fishes. 2009;84:95–107. doi: 10.1007/s10641-008-9393-z. [DOI] [Google Scholar]
- Czarna A., Berndt A., Singh H.R., Grudziecki A., Ladurner A.G., Timinszky G., Kramer A., Wolf E. XStructures of drosophila cryptochrome and mouse cryptochrome1 provide insight into circadian function. Cell. 2013;153:1394–1405. doi: 10.1016/j.cell.2013.05.011. [DOI] [PubMed] [Google Scholar]
- Danecek P., Auton A., Abecasis G., Albers C.A., Banks E., DePristo M.A., Handsaker R.E., Lunter G., Marth G.T., Sherry S.T., et al. The variant call format and VCFtools. Bioinformatics. 2011;27:2156–2158. doi: 10.1093/bioinformatics/btr330. [DOI] [PMC free article] [PubMed] [Google Scholar]
- Depristo M.A., Banks E., Poplin R., Garimella K.V., Maguire J.R., Hartl C., Philippakis A.A., Del Angel G., Rivas M.A., Hanna M., et al. A framework for variation discovery and genotyping using next-generation DNA sequencing data. Nat. Genet. 2011;43:491–498. doi: 10.1038/ng.806. [DOI] [PMC free article] [PubMed] [Google Scholar]
- Dias-Alves T., Mairal J., Blum M.G.B. Loter: a software package to infer local ancestry for a wide range of species. Mol. Biol. Evol. 2018;35:2318–2326. doi: 10.1093/molbev/msy126. [DOI] [PMC free article] [PubMed] [Google Scholar]
- Dowling T.E., Martasian D.P., Jeffery W.R. Evidence for multiple genetic forms with similar eyeless phenotypes in the blind cavefish, Astyanax mexicanus. Mol. Biol. Evol. 2002;19:446–455. doi: 10.1093/oxfordjournals.molbev.a004100. [DOI] [PubMed] [Google Scholar]
- Duboué E.R., Keene A.C., Borowsky R.L. Evolutionary convergence on sleep loss in cavefish populations. Curr. Biol. 2011;21:671–676. doi: 10.1016/j.cub.2011.03.020. [DOI] [PubMed] [Google Scholar]
- Edgar R.C. MUSCLE: a multiple sequence alignment method with reduced time and space complexity. BMC Bioinformatics. 2004;32:1792–1797. doi: 10.1186/1471-2105-5-113. [DOI] [PMC free article] [PubMed] [Google Scholar]
- Elipot Y., Hinaux H., Callebert J., Rétaux S. Evolutionary shift from fighting to foraging in blind cavefish through changes in the serotonin network. Curr. Biol. 2013;23:1–10. doi: 10.1016/j.cub.2012.10.044. [DOI] [PubMed] [Google Scholar]
- Elliott W.R. In: Biology and Evolution of the Mexican Cavefish. Keene Alex, Yoshizawa Masato, McGaugh Suzanne., editors. Elsevier; 2015. Cave biodiversity and ecology of the Sierra de El Abra region; pp. 59–76. [Google Scholar]
- Emre Onat O., Kars M.E., Gül Ş., Bilguvar K., Wu Y., Özhan A., Aydın C., Başak A.N., Trusso M.A., Goracci A., et al. Human CRY1 variants associate with attention deficit/hyperactivity disorder. J. Clin. Invest. 2020;130:3885–3900. doi: 10.1172/JCI135500. [DOI] [PMC free article] [PubMed] [Google Scholar]
- Espinasa L., Ornelas-García C.P., Legendre L., Rétaux S., Best A., Gamboa-Miranda R., Espinosa-Pérez H., Sprouse P. Discovery of two new astyanax cavefish localities leads to further understanding of the species biogeography. Diversity. 2020;12:368. doi: 10.3390/d12100368. [DOI] [Google Scholar]
- Espinasa L., Borowsky R.B. Origins and relationship of cave populations of the blind Mexican tetra, Astyanax fasciatus, in the Sierra de El Abra. Environ. Biol. Fishes. 2001;62:233–237. doi: 10.1023/A:1011881921023. [DOI] [Google Scholar]
- Fitzpatrick M.J., Ben-Shahar Y., Smid H.M., Vet L.E., Robinson G.E., Sokolowski M.B. Candidate genes for behavioural ecology. Trends Ecol. Evol. 2005;20:96–104. doi: 10.1016/j.tree.2004.11.017. [DOI] [PubMed] [Google Scholar]
- Frøland Steindal I.A., Beale A.D., Yamamoto Y., Whitmore D. Development of the Astyanax mexicanus circadian clock and non-visual light responses. Dev. Biol. 2018;441:345–354. doi: 10.1016/j.ydbio.2018.06.008. [DOI] [PMC free article] [PubMed] [Google Scholar]
- Gompert Z., Mandeville E.G., Buerkle C.A. Analysis of population genomic data from hybrid zones. Annu. Rev. Ecol. Evol. Syst. 2017;48:207–229. doi: 10.1146/annurev-ecolsys-110316-022652. [DOI] [Google Scholar]
- Gravel S. Population genetics models of local ancestry. Genetics. 2012;191:607–619. doi: 10.1534/genetics.112.139808. [DOI] [PMC free article] [PubMed] [Google Scholar]
- Green R.E., Krause J., Briggs A.W., Maricic T., Stenzel U., Kircher M., Patterson N., Li H., Zhai W., Fritz M.H., et al. A draft sequence of the Neandertal genome. Science. 2010;328:710–722. doi: 10.1126/science.1188021. [DOI] [PMC free article] [PubMed] [Google Scholar]
- Hausdorf B., Wilkens H., Strecker U. Population genetic patterns revealed by microsatellite data challenge the mitochondrial DNA based taxonomy of Astyanax in Mexico (Characidae, Teleostei) Mol. Phylogenet. Evol. 2011;60:89–97. doi: 10.1016/j.ympev.2011.03.009. [DOI] [PubMed] [Google Scholar]
- Herman A., Brandvain Y., Weagley J., Jeffery W.R., Keene A.C., Kono T.J., Bilandžija H., Borowsky R., Espinasa L., O'Quin K., et al. The role of gene flow in rapid and repeated evolution of cave-related traits in Mexican tetra, Astyanax mexicanus. Mol. Ecol. 2018;27:4397–4416. doi: 10.1111/mec.14877. [DOI] [PMC free article] [PubMed] [Google Scholar]
- Hirayama J., Alifu Y., Hamabe R., Yamaguchi S., Tomita J., Maruyama Y., Asaoka Y., Nakahama K.I., Tamaru T., Takamatsu K., et al. The clock components Period2, Cryptochrome1a, and Cryptochrome2a function in establishing light-dependent behavioral rhythms and/or total activity levels in zebrafish. Sci. Rep. 2019;9:1–15. doi: 10.1038/s41598-018-37879-8. [DOI] [PMC free article] [PubMed] [Google Scholar]
- Hoban S., Kelley J.L., Lotterhos K.E., Antolin M.F., Bradburd G., Lowry D.B., Poss M.L., Reed L.K., Storfer A., Whitlock M.C. Finding the genomic basis of local adaptation: pitfalls, practical solutions, and future directions. Am. Nat. 2016;188:379–397. doi: 10.1086/688018. [DOI] [PMC free article] [PubMed] [Google Scholar]
- Hohenlohe P.A., Bassham S., Currey M., Cresko W.A. Extensive linkage disequilibrium and parallel adaptive divergence across threespine stickleback genomes. Philos. Trans. R. Soc. Lond. B Biol. Sci. 2012;367:395–408. doi: 10.1098/rstb.2011.0245. [DOI] [PMC free article] [PubMed] [Google Scholar]
- Jaggard J., Robinson B.G., Stahl B.A., Oh I., Masek P., Yoshizawa M., Keene A.C. The lateral line confers evolutionarily derived sleep loss in the Mexican cavefish. J. Exp. Biol. 2017;220:284–293. doi: 10.1242/jeb.145128. [DOI] [PubMed] [Google Scholar]
- Janzen T., Nolte A.W., Traulsen A. The breakdown of genomic ancestry blocks in hybrid lineages given a finite number of recombination sites. Evolution. 2018;72:735–750. doi: 10.1111/evo.13436. [DOI] [PMC free article] [PubMed] [Google Scholar]
- Jin W., Li R., Zhou Y., Xu S. Distribution of ancestral chromosomal segments in admixed genomes and its implications for inferring population history and admixture mapping. Eur. J. Hum. Genet. 2014;22:930–937. doi: 10.1038/ejhg.2013.265. https://www.nature.com/articles/ejhg2013265 [DOI] [PMC free article] [PubMed] [Google Scholar]
- Keene A.C., Yoshizawa M., McGaugh S.E. Academic Press; 2015. Biology and Evolution of the Mexican Cavefish, Biology and Evolution of the Mexican Cavefish. [DOI] [Google Scholar]
- Kern A.D., Schrider D.R. Discoal: flexible coalescent simulations with selection. Bioinformatics. 2016;32:3839–3841. doi: 10.1093/bioinformatics/btw556. [DOI] [PMC free article] [PubMed] [Google Scholar]
- Kern A.D., Schrider D.R. DiploS/HIC: an updated approach to classifying selective sweeps. G3. 2018;8:1959–1970. doi: 10.1534/g3.118.200262. [DOI] [PMC free article] [PubMed] [Google Scholar]
- Kowalko J.E., Rohner N., Rompani S.B., Peterson B.K., Linden T.A., Yoshizawa M., Kay E.H., Weber J., Hoekstra H.E., Jeffery W.R., et al. Loss of schooling behavior in cavefish through sight-dependent and sight-independent mechanisms. Curr. Biol. 2013;23:1874–1883. doi: 10.1016/j.cub.2013.07.056. [DOI] [PMC free article] [PubMed] [Google Scholar]
- Kumar P., Henikoff S., Ng P.C. Predicting the effects of coding non-synonymous variants on protein function using the SIFT algorithm. Nat. Protoc. 2009;4:1073–1081. doi: 10.1038/nprot.2009.86. [DOI] [PubMed] [Google Scholar]
- Leitwein M., Cayuela H., Ferchaud A.L., Normandeau É., Gagnaire P.A., Bernatchez L. The role of recombination on genome-wide patterns of local ancestry exemplified by supplemented brook charr populations. Mol. Ecol. 2019;28:4755–4769. doi: 10.1111/mec.15256. [DOI] [PubMed] [Google Scholar]
- Li H., Handsaker B., Wysoker A., Fennell T., Ruan J., Homer N., Marth G., Abecasis G., Durbin R. The sequence alignment/map format and SAMtools. Bioinformatics. 2009;25:2078–2079. doi: 10.1093/bioinformatics/btp352. [DOI] [PMC free article] [PubMed] [Google Scholar]
- Li H., Durbin R. Fast and accurate short read alignment with Burrows-Wheeler transform. Bioinformatics. 2009;25:1754–1760. doi: 10.1093/bioinformatics/btp324. [DOI] [PMC free article] [PubMed] [Google Scholar]
- Luttikhuizen P.C., Drent J., Peijnenburg K.T.C.A., Van der Veer H.W., Johannesson K. Genetic architecture in a marine hybrid zone: comparing outlier detection and genomic clines analysis in the bivalve Macoma balthica. Mol. Ecol. 2012;21:3048–3061. doi: 10.1111/j.1365-294X.2012.05586.x. [DOI] [PubMed] [Google Scholar]
- Malinsky M. Dsuite-fast D-statistics and related admixture evidence from VCF files. BioRxiv. 2019:634477. doi: 10.1111/1755-0998.13265. https://www.biorxiv.org/content/10.1101/634477v2 [DOI] [PMC free article] [PubMed] [Google Scholar]
- Martin M. Cutadapt removes adapter sequences from high-throughput sequencing reads. EMBnet.journal. 2011;17:10. doi: 10.14806/ej.17.1.200. [DOI] [Google Scholar]
- McGaugh S.E., Kowalko J.E., Duboué E., Lewis P., Franz-Odendaal T.A., Rohner N., Gross J.B., Keene A.C. Dark world rises: the emergence of cavefish as a model for the study of evolution, development, behavior, and disease. J. Exp. Zool. Part B Mol. Dev. Evol. 2020;334:397–404. doi: 10.1002/jez.b.22978. [DOI] [PMC free article] [PubMed] [Google Scholar]
- McGaugh S.E.S., Gross J.B., Aken B., Blin M., Borowsky R., Chalopin D., Hinaux H., Jeffery W.R., Keene A., Ma L., et al. The cavefish genome reveals candidate genes for eye loss. Nat. Commun. 2014;5:5307. doi: 10.1038/ncomms6307. [DOI] [PMC free article] [PubMed] [Google Scholar]
- McKenna A., Hanna M., Banks E., Sivachenko A., Cibulskis K., Kernytsky A., Garimella K., Altshuler D., Gabriel S., Daly M., et al. The Genome Analysis Toolkit: a MapReduce framework for analyzing next-generation DNA sequencing data. Genome Res. 2010;20:1297–1303. doi: 10.1101/gr.107524.110. [DOI] [PMC free article] [PubMed] [Google Scholar]
- McLaren W., Hunt L.S.E., Riat H.S., Ritchie G.R.S., Thormann A., Flicek P., Cunningham F. The Ensembl variant effect predictor. Genome Biol. 2016;17:122. doi: 10.1186/s13059-016-0974-4. Gil [DOI] [PMC free article] [PubMed] [Google Scholar]
- Mitchell R.W., Russell W.H., Elliott W.R. Texas Tech Press; 1977. Mexican Eyeless Characin Fishes, Genus Astyanax: Environment, Distribution, and Evolution. [Google Scholar]
- Moran D., Softley R., Warrant E.J. Eyeless Mexican cavefish save energy by eliminating the circadian rhythm in metabolism. PLoS One. 2014;9:e107877. doi: 10.1371/journal.pone.0107877. [DOI] [PMC free article] [PubMed] [Google Scholar]
- Niepoth N., Bendesky A. How natural genetic variation shapes behavior. Annu. Rev. Genom. Hum. Genet. 2020;21:437–463. doi: 10.1146/annurev-genom-111219-080427. [DOI] [PubMed] [Google Scholar]
- O’Quin K.E., Yoshizawa M., Doshi P., Jeffery W.R. Quantitative genetic analysis of retinal degeneration in the blind cavefish Astyanax mexicanus. PLoS ONE. 2013;8:e57281. doi: 10.1371/journal.pone.0057281. [DOI] [PMC free article] [PubMed] [Google Scholar]
- Ornelas-García C.P., Domínguez-Domínguez O., Doadrio I. Evolutionary history of the fish genus Astyanax baird & Girard (1854) (Actinopterygii, Characidae) in mesoamerica reveals multiple morphological homoplasies. BMC Evol. Biol. 2008;8:340. doi: 10.1186/1471-2148-8-340. [DOI] [PMC free article] [PubMed] [Google Scholar]
- Patterson B.D., Upham N.S. A newly recognized family from the Horn of Africa, the Heterocephalidae (Rodentia: Ctenohystrica) Zoolog. J. Linn. Soc. 2014;172:942–963. doi: 10.1111/zoj.12201. [DOI] [Google Scholar]
- Pickrell J.K., Pritchard J.K. Inference of population splits and mixtures from genome-wide allele frequency data. PLoS Genet. 2012;8:e1002967. doi: 10.1371/journal.pgen.1002967. [DOI] [PMC free article] [PubMed] [Google Scholar]
- Powell D.L., García-Olazábal M., Keegan M., Reilly P., Du K., Díaz-Loyo A.P., Banerjee S., Blakkan D., Reich D., Andolfatto P., et al. Natural hybridization reveals incompatible alleles that cause melanoma in swordtail fish. Science. 2020;368:731–736. doi: 10.1126/science.aba5216. [DOI] [PMC free article] [PubMed] [Google Scholar]
- Protas M., Tabansky I., Conrad M., Gross J.B., Vidal O., Tabin C.J., Borowsky R. Multi-trait evolution in a cave fish, Astyanax mexicanus. Evol. Dev. 2008;10:196–209. doi: 10.1111/j.1525-142X.2008.00227.x. [DOI] [PubMed] [Google Scholar]
- Protas M.E., Hersey C., Kochanek D., Zhou Y., Wilkens H., Jeffery W.R., Zon L.I., Borowsky R., Tabin C.J. Genetic analysis of cavefish reveals molecular convergence in the evolution of albinism. Nat. Genet. 2006;38:107–111. doi: 10.1038/ng1700. [DOI] [PubMed] [Google Scholar]
- Purcell S., Neale B., Todd-Brown K., Thomas L., Ferreira M.A., Bender D., Maller J., Sklar P., de Bakker P.I., Daly M.J., et al. PLINK: a tool set for whole-genome association and population-based linkage analyses. Am. J. Hum. Genet. 2007;81:559–575. doi: 10.1086/519795. [DOI] [PMC free article] [PubMed] [Google Scholar]
- Riccio A.P., Goldman B.D. Circadian rhythms of locomotor activity in naked mole-rats (Heterocephalus glaber) Physiol. Behav. 2000;71:1–13. doi: 10.1016/S0031-9384(00)00281-X. [DOI] [PubMed] [Google Scholar]
- Romero A. Introgressive hybridization in the Astyanax fasciatus (Pisces: Characidae) population at La Cueva Chica. NSS Bull. 1983;45:81–85. [Google Scholar]
- Schneider C.A., Rasband W.S., Eliceiri K.W. NIH Image to ImageJ: 25 years of image analysis. Nature methods. 2012;9(7):671–675. doi: 10.1038/nmeth.2089. [DOI] [PMC free article] [PubMed] [Google Scholar]
- Schumer M., Cui R., Powell D.L., Rosenthal G.G., Andolfatto P. Ancient hybridization and genomic stabilization in a swordtail fish. Mol. Ecol. 2016;25:2661–2679. doi: 10.1111/mec.13602. [DOI] [PubMed] [Google Scholar]
- Schumer M., Xu C., Powell D.L., Durvasula A., Skov L., Holland C., Blazier J.C., Sankararaman S., Andolfatto P., Rosenthal G.G., et al. Natural selection interacts with recombination to shape the evolution of hybrid genomes. Science. 2018;360:656–660. doi: 10.1126/science.aar3684. [DOI] [PMC free article] [PubMed] [Google Scholar]
- Stahl B.A., Sears C.R., Ma L., Perkins M., Gross J.B. In: Origin and Evolution of Biodiversity. Pontarotti Pierre., editor. Springer; 2018. Pmela and Tyrp1b contribute to melanophore variation in Mexican cavefish; pp. 3–22. [Google Scholar]
- Strecker U., Bernatchez L., Wilkens H. Genetic divergence between cave and surface populations of Astyanax in Mexico (Characidae, Teleostei) Mol. Ecol. 2003;12:699–710. doi: 10.1046/j.1365-294X.2003.01753.x. [DOI] [PubMed] [Google Scholar]
- Strecker U., Hausdorf B., Wilkens H. Parallel speciation in Astyanax cave fish (Teleostei) in Northern Mexico. Mol. Phylogenet. Evol. 2012;62:62–70. doi: 10.1016/j.ympev.2011.09.005. [DOI] [PubMed] [Google Scholar]
- Taylor S.A., Larson E.L. Insights from genomes into the evolutionary importance and prevalence of hybridization in nature. Nat. Ecol. Evol. 2019;3:170–177. doi: 10.1038/s41559-018-0777-y. [DOI] [PubMed] [Google Scholar]
- Tigano A., Friesen V.L. Genomics of local adaptation with gene flow. Mol. Ecol. 2016;25:2144–2164. doi: 10.1111/mec.13606. [DOI] [PubMed] [Google Scholar]
- vonHoldt B.M., Kays R., Pollinger J.P., Wayne R.K. Admixture mapping identifies introgressed genomic regions in North American canids. Mol. Ecol. 2016;25:2443–2453. doi: 10.1111/mec.13667. [DOI] [PubMed] [Google Scholar]
- Wang J., Street N.R., Scofield D.G., Ingvarsson P.K. Variation in linked selection and recombination drive genomic divergence during allopatric speciation of European and American aspens. Mol. Biol. Evol. 2016;33:1754–1767. doi: 10.1093/molbev/msw051. [DOI] [PMC free article] [PubMed] [Google Scholar]
- Warren W.C., Boggs T.E., Borowsky R., Carlson B.M., Ferrufino E., Gross J.B., Hillier L., Hu Z., Keene A.C., Kenzior A., et al. A chromosome-level genome of Astyanax mexicanus surface fish for comparing population-specific genetic differences contributing to trait evolution. Nature communications. 2021;12(1):1–12. doi: 10.1038/s41467-021-21733-z. [DOI] [PMC free article] [PubMed] [Google Scholar]
- Waterhouse A., Bertoni M., Bienert S., Studer G., Tauriello G., Gumienny R., Heer F.T., de Beer T.A.P., Rempfer C., Bordoli L., et al. SWISS-MODEL: homology modelling of protein structures and complexes. Nucleic Acids Res. 2018;46:W296–W303. doi: 10.1093/nar/gky427. [DOI] [PMC free article] [PubMed] [Google Scholar]
- Yang J., Chen X., Bai J., Fang D., Qiu Y., Jiang W., Yuan H., Bian C., Lu J., He S., et al. The Sinocyclocheilus cavefish genome provides insights into cave adaptation. BMC Biol. 2016;14:1. doi: 10.1186/s12915-015-0223-4. [DOI] [PMC free article] [PubMed] [Google Scholar]
- Yoshizawa M., Goricki S., Soares D., Jeffery W.R. Evolution of a behavioral shift mediated by superficial neuromasts helps cavefish find food in darkness. Curr. Biol. 2010;20:1631–1636. doi: 10.1016/j.cub.2010.07.017. [DOI] [PMC free article] [PubMed] [Google Scholar]
- Yoshizawa M., Robinson B.G., Duboué E.R., Masek P., Jaggard J.B., O’Quin K.E., Borowsky R.L., Jeffery W.R., Keene A.C. Distinct genetic architecture underlies the emergence of sleep loss and prey-seeking behavior in the Mexican cavefish. BMC Biol. 2015;13:1–12. doi: 10.1186/s12915-015-0119-3. [DOI] [PMC free article] [PubMed] [Google Scholar]
Associated Data
This section collects any data citations, data availability statements, or supplementary materials included in this article.
Supplementary Materials
The sheet SummaryStatsAllGenes includes from left to right, GeneID, Scaffold, Start, End, Gene Symbol, Gene Description, associated phenotypes from Ensembl BioMart v104 (in zebrafish, mouse, and human), whether the phenotype descriptions contain keywords associated with phenotypes known to be involved in cave adaptation (e.g., eye/lens/retina), absolute genetic divergence (Dxy) and associated summary statistics for each gene in comparisons between Chica Pool 1 and Pool 2, Rascón and Tinaja, and Rascón and Pachón, summaries of the number of detected deleterious variants in SIFT and VEP in silico analyses, and results diploS/HIC selection analyses (conducted in 5 kb windows throughout the genome) for each gene. We also present the percent rank (i.e., the relative ranking of each value within the dataset) for each gene for mean Dxy between Pachón and Rascon, mean Dxy between Tinaja and Rascon, and maximum Fst between Chica Pool 1 and Chica Pool 2. Rows containing genes in the top 5% of Dxy values between Chica Pool 1 and Chica Pool 2 are highlighted in light green. The sheets GeneOntologyEnrichment and PhenotypeEnrichment show the results of the GO enrichment analysis and phenotype enrichment analyses, respectively, on genes with highest genetic divergence (top 5% Dxy) between Chica Pool 1 and Chica Pool 2. For the GO enrichment results, genes with phenotypes known to be adaptive in cave environments and highlighted. (See excel file.)
Data Availability Statement
Data - Sequence data generated in this study have been depostited in the NCBI Sequence Read Archive and are publically available as of the date of publication. Accession numbers are listed in the key resources table. Original data underlying genotyping of the cry1a mutation from Astyanax cDNA can be accessed from the Stowers Original Data Repository (URL available in key resources table).
Code - All original code has been deposited to GitHub and has been made publically available as of the date of publication (URL available in key resource table).
Other - Any additional information required to reanalyze the data reported in this paper is available from the lead contact upon request.