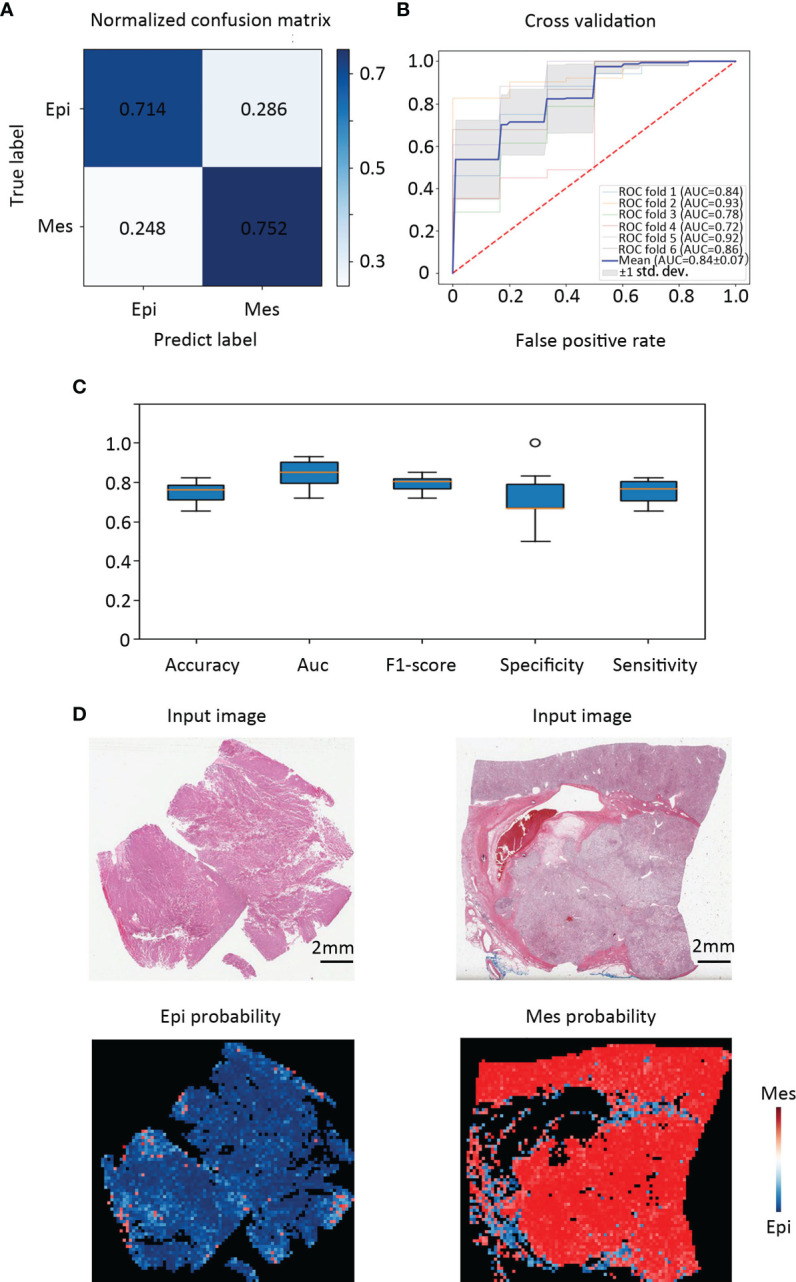
Figure 3.

Classification performance in an external validation set and class activation maps for morphological features. (A) Confusion matrix of the classification results of the validation patients. (B) Training and validation on TCGA cohort were performed using six-fold repeated validation with a 90% (training) to 10% (validation) stratified, random split for each fold. (C) Classifier performance was assessed including accuracy, F1 score, AUC, specificity, and sensitivity separately for each EMT molecular subtype. (D) Tissue slides of patients with Epi and Mes tumors in TCGA test set show the spatial patterns of predicted MSI score. The top panel shows the H&E input image. Corresponding predicted Epi and Mes map for the image shown in the bottom panel. Class activation maps for morphological features.
