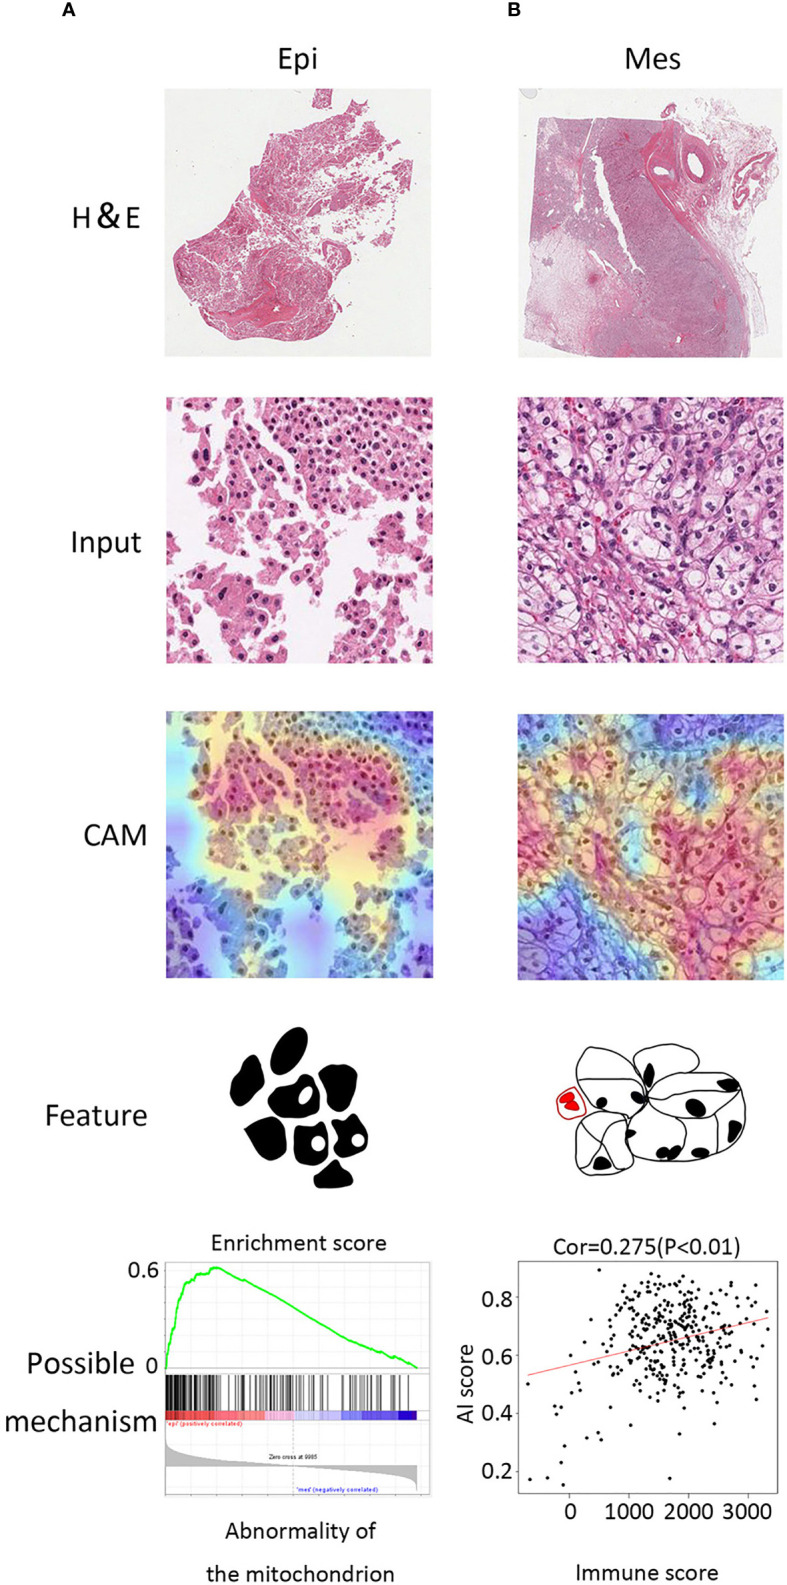
Figure 4.

Class activation maps for morphological features. (A) Macrograph (top), input image (second from top), CAM (third from top), and corresponding sketch maps of predominant morphological feature (bottom) for EMT subtypes (from left to right: Epi and Mes). Epi region is a granular eosinophilic cytoplasm area with a looser arrangement, big cell gap, nucleoli absent. Mes region contained mostly tumor cells with empty cytoplasm and mixed with immune cells. (B) GSEA plot of abnormality of the mitochondrion in Epi cluster (left) and positive correlation between AI score and immune score (estimated by the ESTIMATE algorithm).
