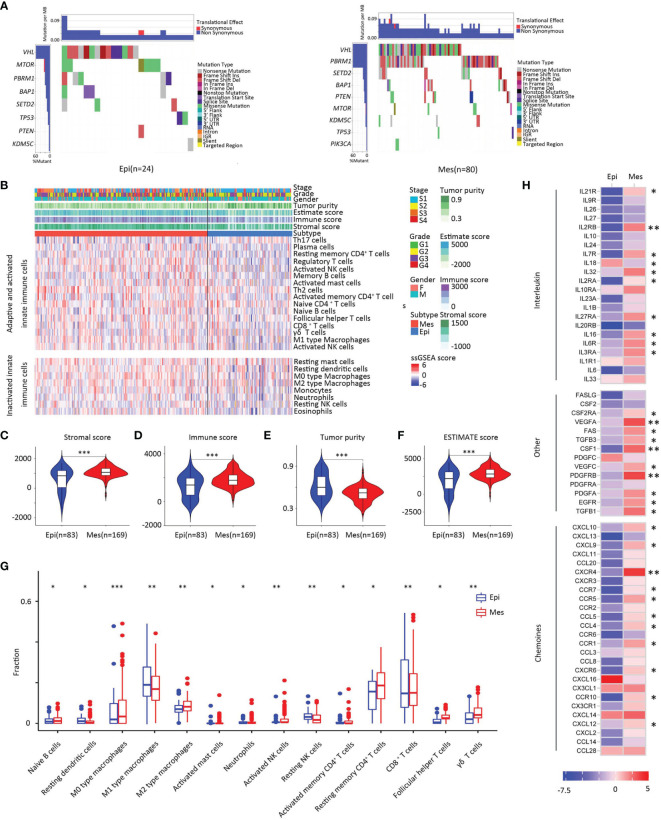
Figure 6.
Somatic alterations in EMT subtypes. (A) Upper heat map, mutation events per sample; lower heat map, mutation types, and events (left, Epi group; right, Mes group). (B) Landscape of the microenvironment phenotypes in EMT subtypes, K-means clustering of microenvironment phenotypes based on the estimated numbers of 24 microenvironment cell subsets calculated by ssGSEA (Epi type, blue; Mes type red). Tumor stage (stage I, light blue; stage II yellow; stage III, orange; stage IV, red), grade (grade 1, green; grade 2, yellow; grade 3, purple; grade 4, red), gender (male, blue; female, pink), and scores estimated by the ESTIMATE algorithm. (C–F) Scores of stromal, immune, tumor purity, and ESTIMATE between clusters. In the violin plots, the mean values are plotted as dots, and the boxplot is drawn inside of the violin plot. (G) Boxplot plot for comparison of the immune cell fraction difference between Epi and Mes tissues. Fractions of each immune cell type were compared by means of a two-sided Mann–Whitney U test. Blue color indicates Epi type and red indicates Mes type. (H) Log2-fold change in mRNA expression in the tumor tissues of chemokines, interleukins, interferons, and other important cytokines and their receptors for each cluster. Molecules with significantly differential expression between the tumor site and the paired normal site (P < 0.01) were illustrated. (***, P < 0.001; **, 0.001 < P < 0.01; *, 0.01 < P < 0.05; ns, P > 0.05).

