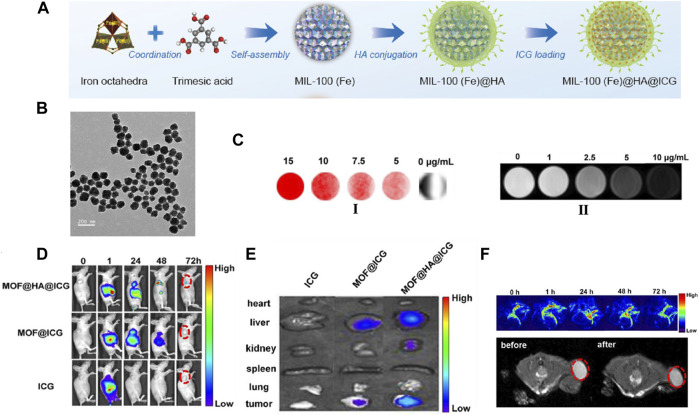
FIGURE 10.
(A) Schematic description of the synthesis process of HA conjugated, ICG loading of MIL-100(Fe) nanomaterial. (B) TEM images of the MOF@HA@ICG NPs. (C) FL images (I) and T2-weighted MR images (II) of cells treated with MOF@HA@ICG solutions. (D) FL images of MCF-7 tumor-bearing mice injected with free ICG, MOF@ICG, or MOF@HA@ICG solutions (each with 170 μg/ml of ICG; the tumors are highlighted by red circles). (E) In vitro FL images of organs (heart, liver, kidney, spleen, and lung) and tumors. (F) In vivo PA images and T2-weighted MR images with MOF@HA@ICG treatment. The tumors are highlighted by red circles. Source: (Li et al., 2015).

