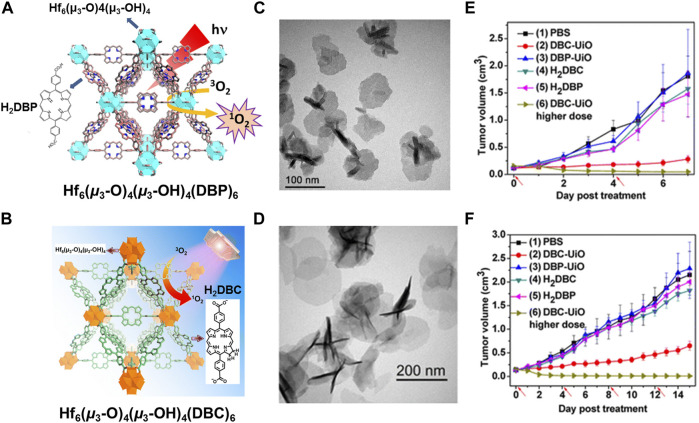
FIGURE 6.
(A) The structure of Hf−DBP NMOF and the schematic description of 1O2 generation process. (B) The structure of Hf−DBC NMOF and the schematic description of 1O2 generation process. (C) TEM image of DBP−UiO with nanoplate morphology. (D) TEM image of DBC−UiO with nanoplate morphology. In vivo PDT efficacy on CT26 and HT29 tumor-bearing mice: (E) Tumor growth inhibition curve after PDT treatment by DBP−UiO. (F) Tumor growth inhibition curve after PDT treatment by DBC−UiO. Source: (Lu et al., 2014; Lu et al., 2015).

