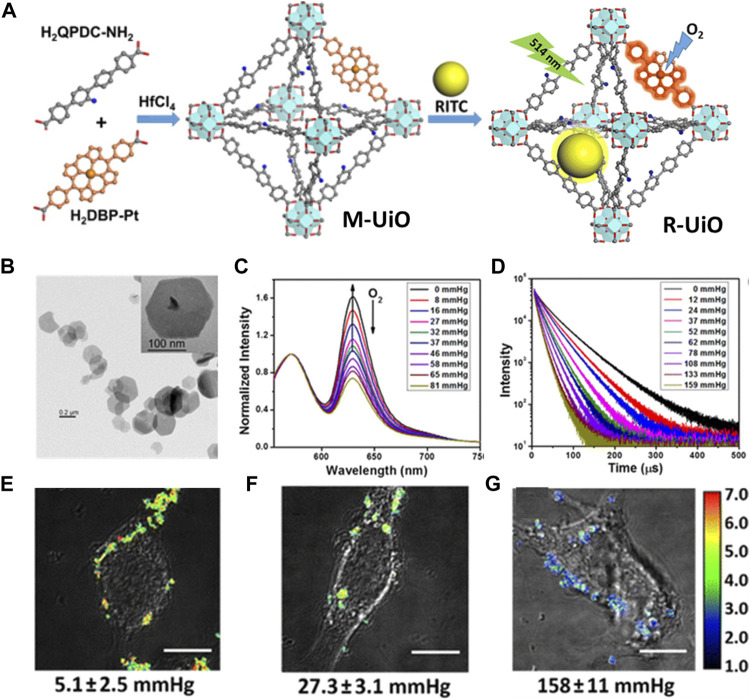
FIGURE 8.
(A) The schematic illustration of synthesis process of mixed-ligand M-UiO NMOF and R-UiO NMOF; Schematic illustration of R-UiO NMOF offers oxygen generation under 514 nm light irradiation. (B) TEM images of R-UiO. (C) Emission spectra (λex = 514 nm) and (D) phosphorescent decays (λex = 405 nm) of R-UiO-1 in HBSS buffer under various oxygen partial pressures. Ratiometric luminescence imaging (λex = 514 nm) of CT26 cells after incubation with R-UiO-2 under (E) hypoxia, (G) normoxia, and (F) aerated conditions. Scale bar: 10 μm. Source: (Xu et al., 2016).

