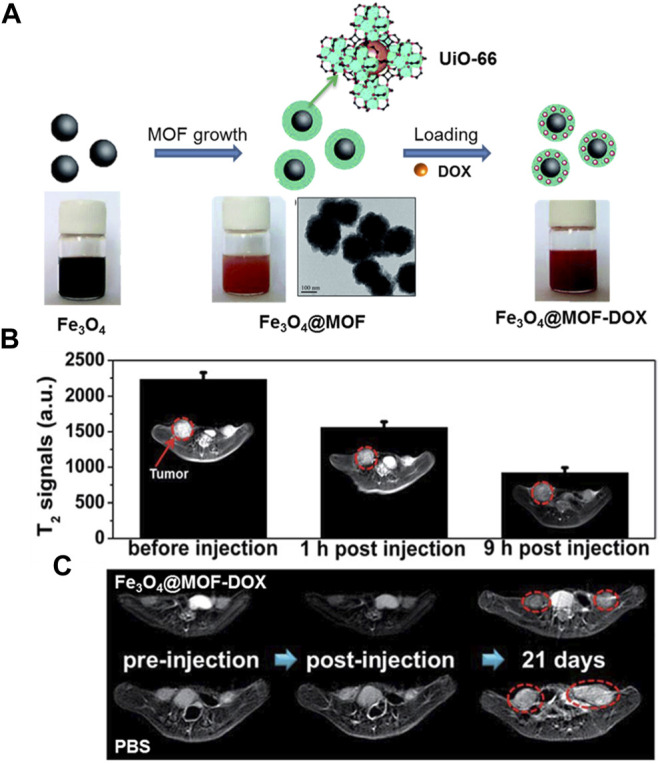
FIGURE 9.

(A) The schematic illustration of the fabrication of Fe3O4@MOF core–shell composites. (B) T2-weighted MR images and T2-MR signals of tumor on HeLa-tumor bearing mice before injection, 1 and 9 h post injection of Fe3O4@UiO-66 intravenously (tumor region marked by red cycles). (C) MRI of HeLa-tumor bearing mice treated with PBS or Fe3O4@UiO-66-DOX collected at different time points (tumor region marked by red cycles). Source: (Zhao et al., 2016a).
