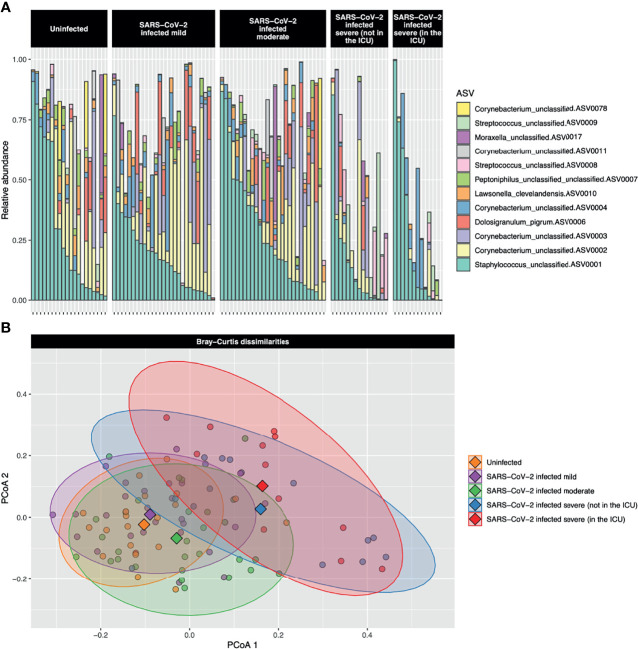
Figure 1.
(A) Stacked bar charts of the relative abundance of the 12 most abundant amplicon sequence variants (ASVs) are shown for each study participant. The most abundant ASV, Staphylococcus_unclassified.ASV0001, was abundant both in uninfected controls and participants with the full range of COVID-19 severities. The second most abundant ASV, Corynebacterium_unclassified.ASV0002, was highly abundant in uninfected control participants and those with mild-to-moderate COVID-19, but was of low abundance in those with severe or very severe COVID-19. (B) A principal coordinate analysis (PCoA) plot of the Bray–Curtis dissimilarities over the first two axes is shown. Dots represent individual data points and diamonds show the centroids. The 90% confidence data ellipses are shown for each of the COVID-19 severity groups. Overall, microbial community composition was significantly dissimilar among the severity groups (P < 0.001).

