
FIGURE 1.
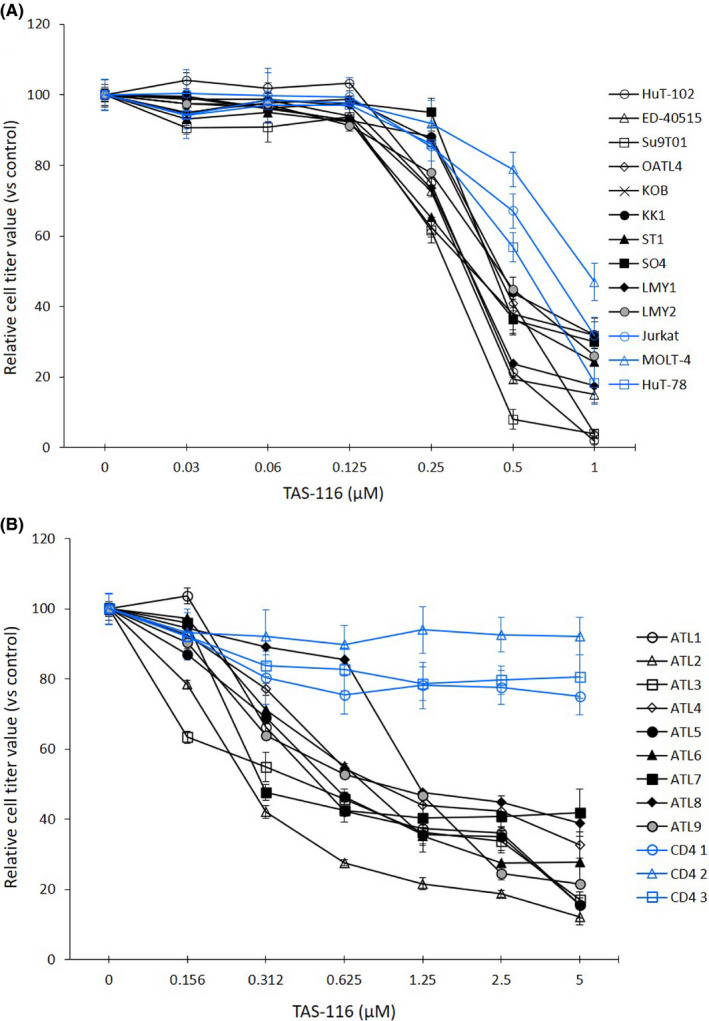
Growth inhibition of adult T‐cell leukemia/lymphoma (ATL)‐related cell lines and primary ATL cells after TAS‐116 treatment. A, ATL‐related cell lines (black), non‐ATL leukemia cell lines (blue) (2‐5 × 10⁵ cells/mL). B, PBMCs from ATL patients (black), and CD4+ lymphocytes from healthy donors (blue) (1 × 10⁶ cells/mL) were treated with DMSO (control) or various concentrations of TAS‐116 for 72 h and cell viability was evaluated. All experiments were carried out in triplicate, and data are expressed as the mean ± SD