
FIGURE 2.
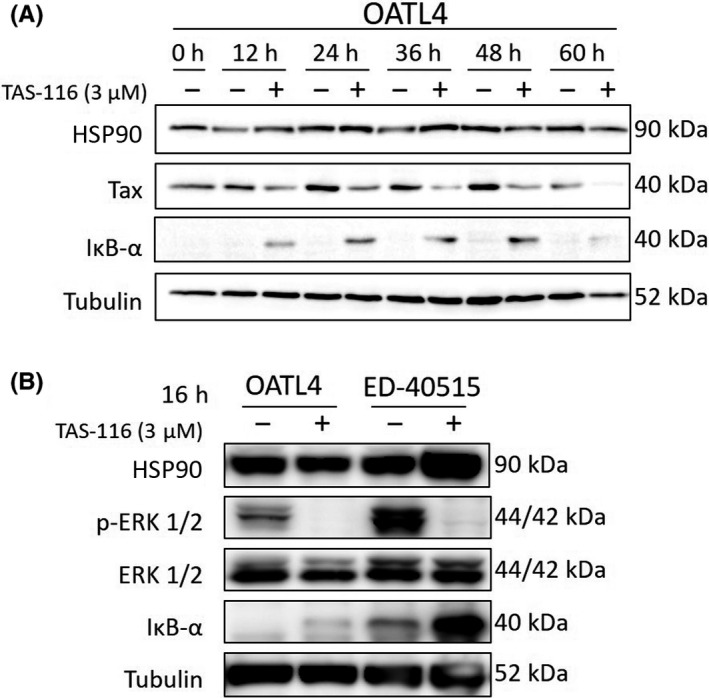
Time‐course analysis of Tax degradation or ERK inhibition after TAS‐116 treatment. Cells (1 × 10⁶/mL) were treated with DMSO or TAS‐116 at various concentrations. A, Western blot analysis was carried out on cells collected every 12 h for a total of 60 h. B, After 16 h, cells were harvested, and western blotting was carried out to compare the Tax levels in Tax‐positive (OATL4) and Tax‐negative cells (ED‐40515). Tubulin was used as the internal control. HSP90, heat shock protein 90