
FIGURE 4.
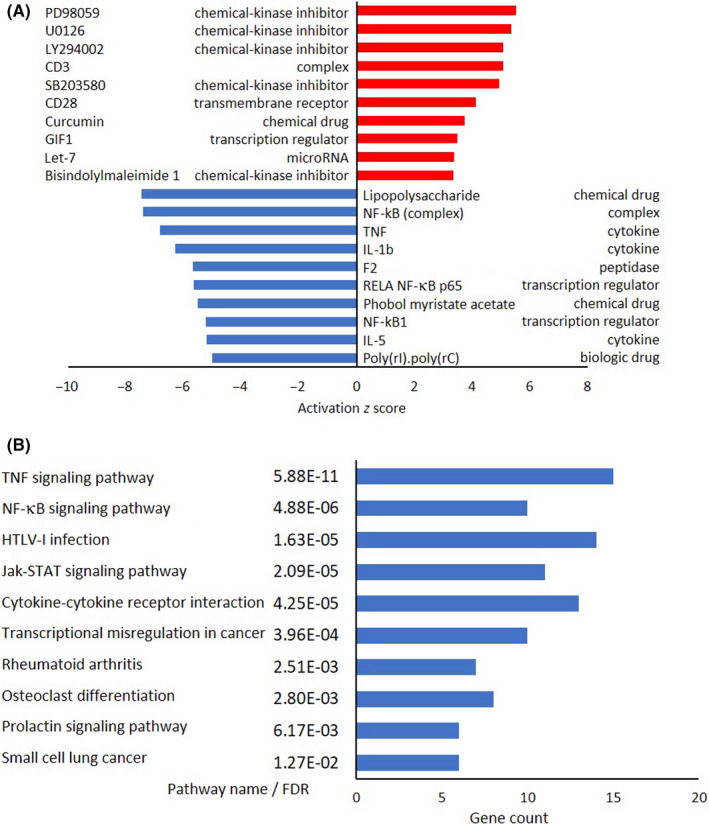
Microarray and pathway analyses of Tax‐positive adult T‐cell leukemia/lymphoma cell lines. A, Ingenuity Pathway Analysis of Tax‐positive cells (HuT‐102 and OATL4). Top 10 activated upstream regulators in Tax‐positive cells and their functions are shown according to activation z score. Red bars, increased; blue bars, decreased. B, Kyoto Encyclopedia of Genes and Genomes pathway analysis of Tax‐positive cells. Top 10 downregulated pathways in Tax‐positive cells, along with their gene count, are shown according to their false discovery rate (FDR). Blue bars, downregulated. GIF1, Growth‐regulating factor‐interacting factor 1; HTLV‐1, human T‐cell leukemia virus type 1; IL, interleukin; NF‐κB, nuclear factor‐κB; TNF, tumor necrosis factor